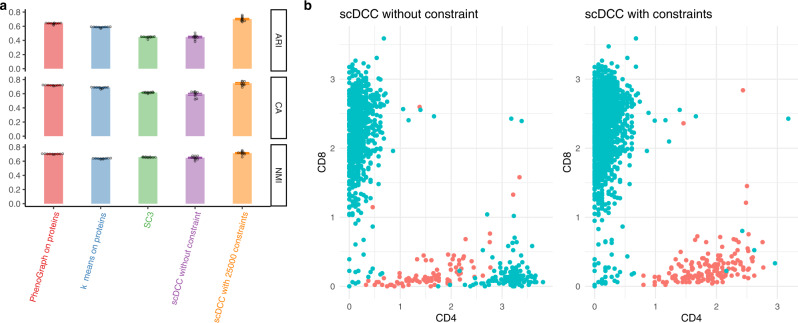
Fig. 5. Clustering analysis on the CITE-seq PBMC data with protein-based constraints.
a Clustering performances of PhenoGraph and k-means on proteins, SC3, and scDCC (without and with constraints) on mRNAs of CITE-seq PBMC dataset, measured by NMI, CA, and ARI. All experiments are repeated ten times (one dot represents one experiment), and the means and standard errors are displayed. Constraints were generated from protein expression levels. b CD4 and CD8 protein expression levels in the identified CD4 and CD8 specific cells. Colors (Cyan represents CD8 cells and red represents CD4 cells) are cluster labels identified by scDCC with and without constraints on proteins. Cell labels were annotated by differential expression analysis.

