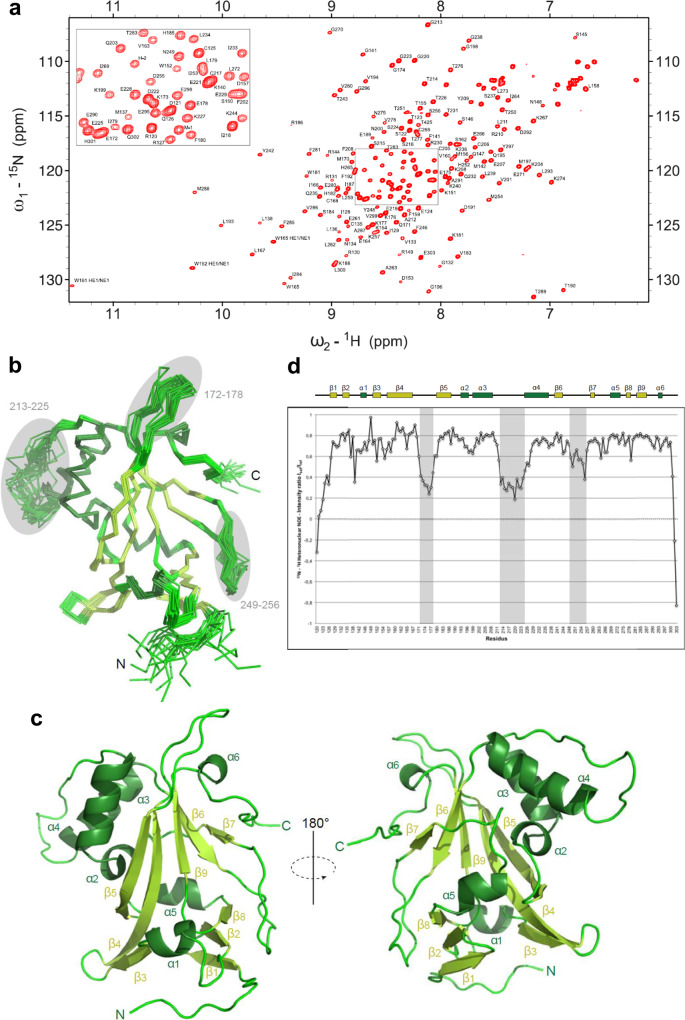
Fig. 5. Solution 3D structure of Bcd1p120-303.
a 1H-15N-HSQC spectra of Bcd1p120-303. The assigned peaks are labeled (ω = frequency). The box shows a zoom of the center of the spectra. b Ribbon representation of the 20 best NMR solutions for the 3D structure of Bcd1p120-303. Flexible loops are circled in gray and labelled. Secondary structure elements are α-helices (in dark green) and β-strands (in light green). N and C are the N-terminal and C-terminal extremities of the protein, respectively. c Two opposite views 180° apart in a cartoon representation of Bcd1p120-303 with secondary structures labeled and numbered. The color code is the same as in panel b. d NMR heteronuclear nOe. Residue numbers are indicated at the bottom. Secondary structure elements are represented at the top in the same colors as in panel b. The flexible internal regions are highlighted in gray, and reported in panel b.

