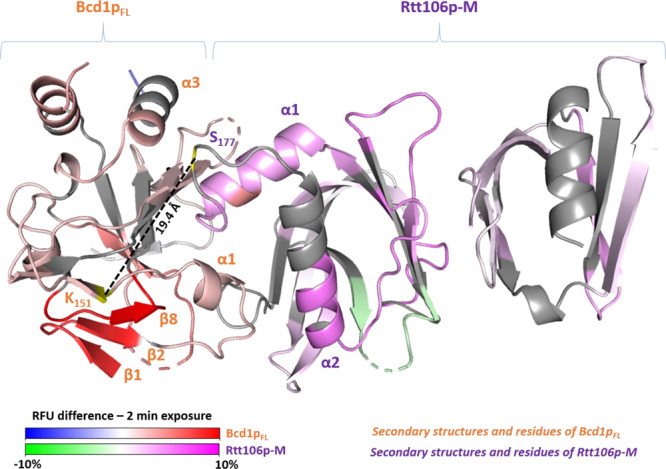
Fig. 7. Summary of the XL-MS and HDX-MS experiments.

Relative fractional uptake (RFU) differences export on the crystal structure of the complex between Rtt106p-M and Bcd1pFL determined by hydrogen deuterium exchange mass spectrometry (HDX-MS). Export is realized for 2 min deuteration experiments. Differences are color scaled on Bcd1pFL from blue (deprotection) to red (protection) upon Rtt106p-M binding (−10% to 10% RFU difference range). Differences are color scaled on Rtt106p-M from green (deprotection) to magenta (protection) upon Bcd1pFL binding (−10% to 10% RFU difference range). The Cα-Cα distances of intercross-linked peptides are represented with black dotted lines. Orange residues and secondary structures represent the most affected regions on Bcd1pFL while the purple ones represent the most affected regions on Rtt106p-M.
