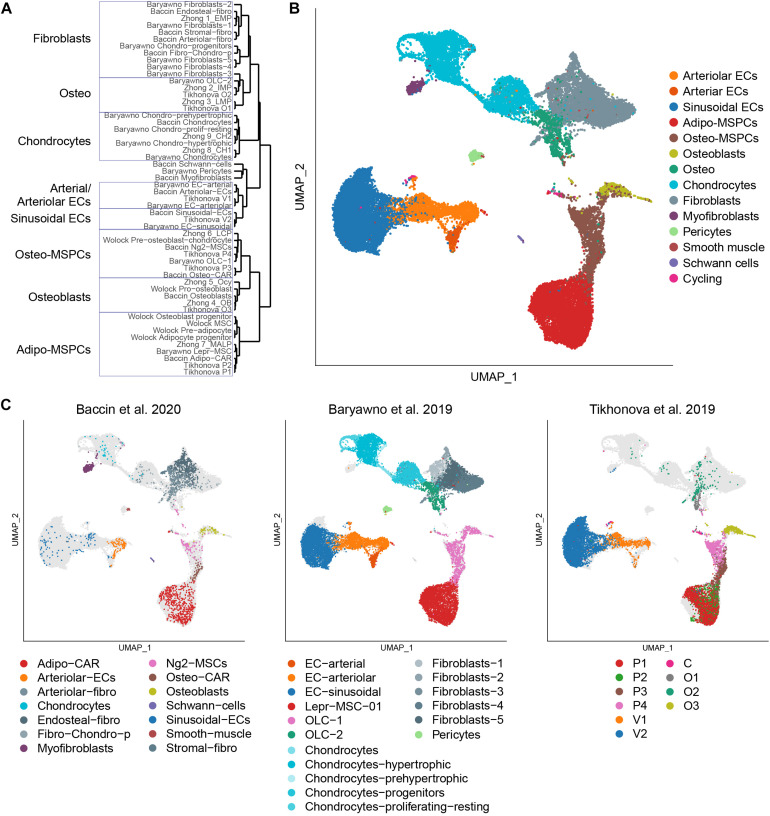
FIGURE 1.
Integrated analysis of the bone marrow niche datasets. (A) Hierarchical clustering of the populations profiled in the discussed studies based on the scaled expression correlation distances of cluster marker genes. (B) UMAP visualization of all 32,743 cells from the integrated analysis, color-coded based on the harmonized population labels. (C) UMAP visualization of each of the datasets, color-coded based on the original population labels. Cells from the non-represented datasets are shown in light gray.

