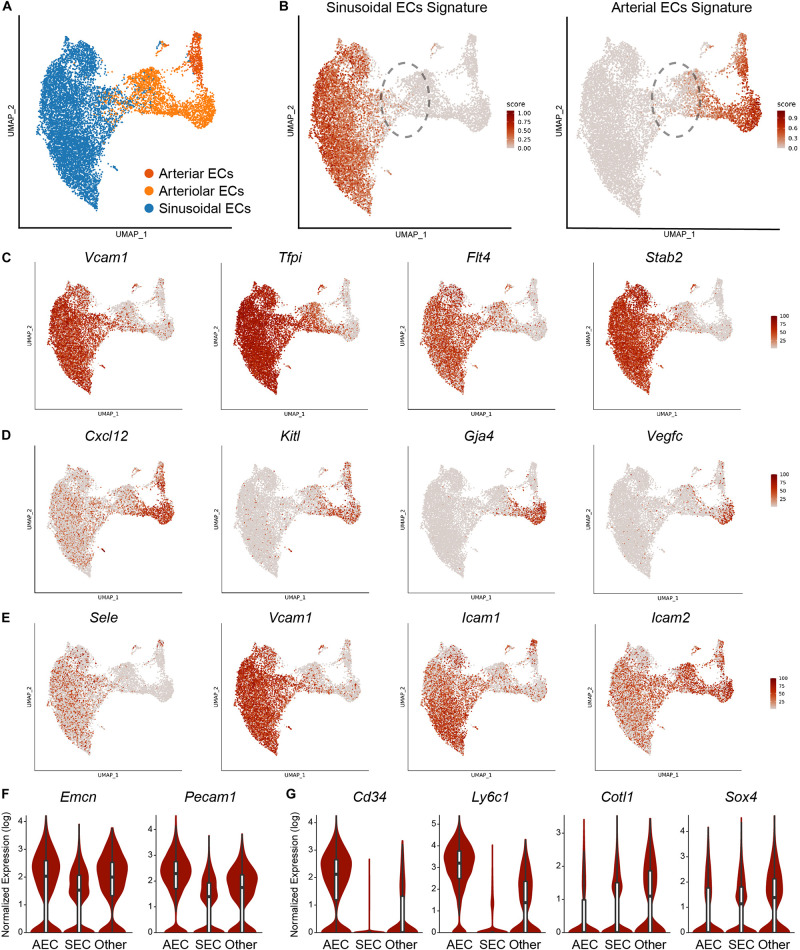
FIGURE 3.
Analysis of the EC subset. (A) UMAP visualization of 10,578 ECs from the integrated analysis, color-coded based on the harmonized population labels. (B) Module scores for sinusoidal and arterial gene signatures overlaid on the UMAP. Dashed outline highlights the population not enriched for sinusoidal or arterial signatures. Expression of sinusoidal (C) and arteriolar (D) marker genes as well as adhesion molecules (E) overlaid on the UMAP representation. (F) Expression of transitional H vessel cell-surface markers within the populations defined by sinusoidal and arterial EC signatures. (G) Expression of marker genes within the populations defined by sinusoidal and arterial EC signatures.

