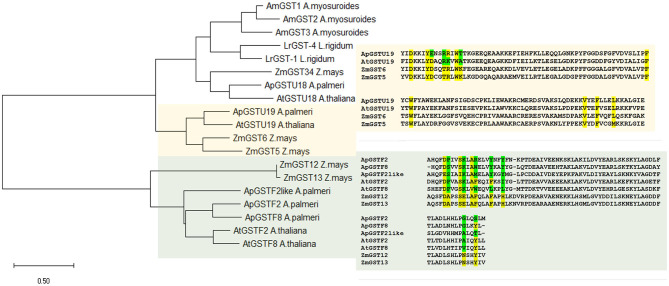
Figure 5.
Phylogenetic and active site analysis of selected GSTs from different species. The selected GSTs were analyzed from Arabidopsis thaliana, Zea mays, Lolium rigidum, Aloperucrus myosuroides, and Amaranthus palmeri. The evolutionary history was inferred using the Maximum Likelihood method and JTT matrix-based model (Jones et al., 1992). The tree is drawn to scale, with branch lengths measured in the number of substitutions per site. This analysis involved 19 amino acid sequences, and the final dataset was composed of 285 positions. Evolutionary analyses were conducted in MEGA X (Kumar et al., 2018). Active site in candidate ApGSTU19 and ApGSTF8 was identified by comparing the sequence with Z. mays. Highlighted in yellow is the conserved and green is the polymorphic compared to Z. mays active site residue. Multiple sequence alignment was carried out using uniport align tool using ApGSTU19, ApGSTF8, ApGSTF2, and ApGSTF2like from A. palmeri, AtGSTU19 (AT1G78380), AtGSTF2 (AT4G02520), and AtGSTF8 (AT1G02920) in A. thaliana and ZmGST5 (CAA73369), ZmGST6 (CAB38120), ZMGST12 (AAG34820), and ZmGST13 in Z. mays (AAG34821).

