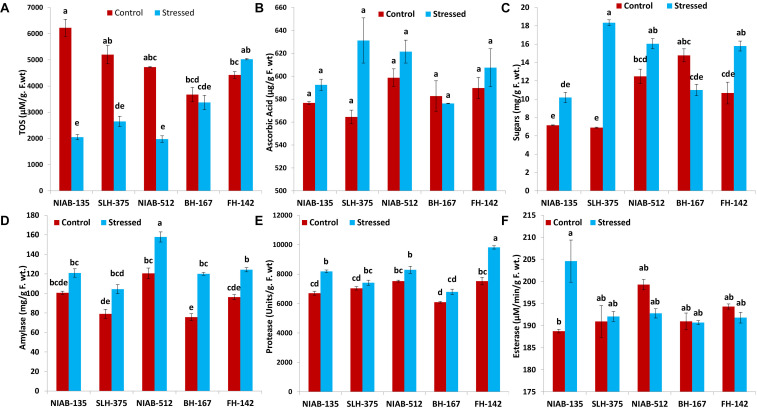
FIGURE 7.
Graphical representations of total oxidant status (TOS; A), ascorbic acid (B), sugars (C), amylase (D), protease (E), and esterase (F) of cotton genotypes under non-stressed and drought stressed conditions. Different lowercase letters indicate statistical analysis, i.e., Tukey’s honestly significant difference test or Tukey’s HSD.

