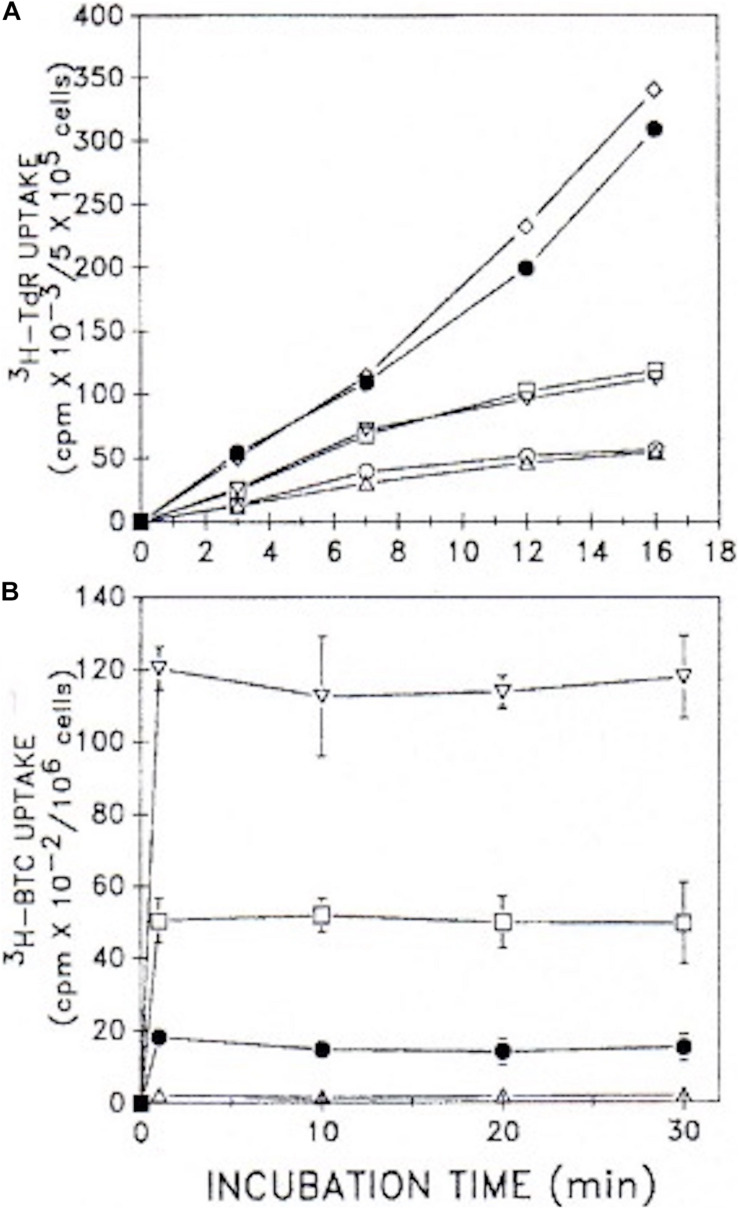
FIGURE 9.
Uptake kinetics of [3H]TdR and [3H]BTC into cells. (A) [3H]TdR uptake kinetics were assessed in unsynchronized 70Z/3 murine lymphoma cultures (5 × 10⁵ cells/ml) plus and minus 10 mM BTC. Cells were incubated for the times indicated with varying [3H]TdR concentrations. Mean values of two experiments performed in duplicate are shown. △, □, •, minus BTC; and ○, ▽, ◇, plus 10 mM BTC, with 1, 3, or 6 μCi [3H]TdR under both conditions, respectively. (B) [5-3H]BTC uptake kinetics were assessed in unsynchronized cultures (106 cells/ml) over the time course shown. Increasing concentrations of BTC (0.1–10 mM) together with [5-3H]BTC were employed under a constant specific activity of 1 μCi/0.1 mM. Two experiments performed in duplicate (±SD) are given. △, with 0.1 mM BTC; •, with 1 mM BTC; □ with 5 mM BTC; ▽, with 10 mM BTC (adapted with permission, Rao and Coleman, 1989).

