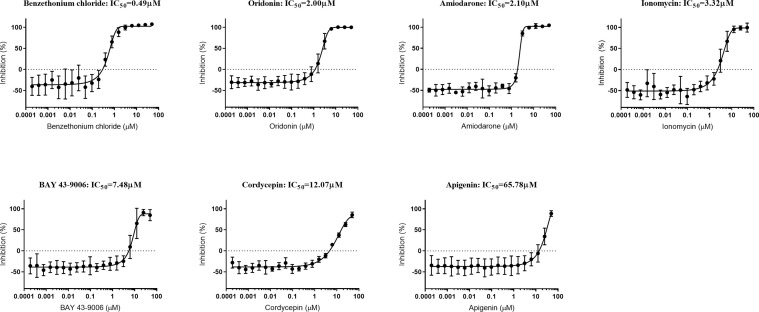
Figure 5.
Growth-inhibition curves of P. falciparum exposed to seven eryptosis inducers. In vitro asynchronous cultures of P. falciparum were cultured in cRPMI with a range of concentrations of compounds (up to 50 µM) for 72 h. DNA content was measured as a proxy for parasite growth, and normalized with the positive inhibition control (cultures exposed to chloroquine and artemisinin) and with the negative inhibition control (cultures exposed to DMSO). IC50 concentrations are indicated for each compound in µM. Data presented corresponds to five independent experiments performed in triplicate (N=5). Each IC50 curve is represented as the mean and SD of the five independent experiments.

