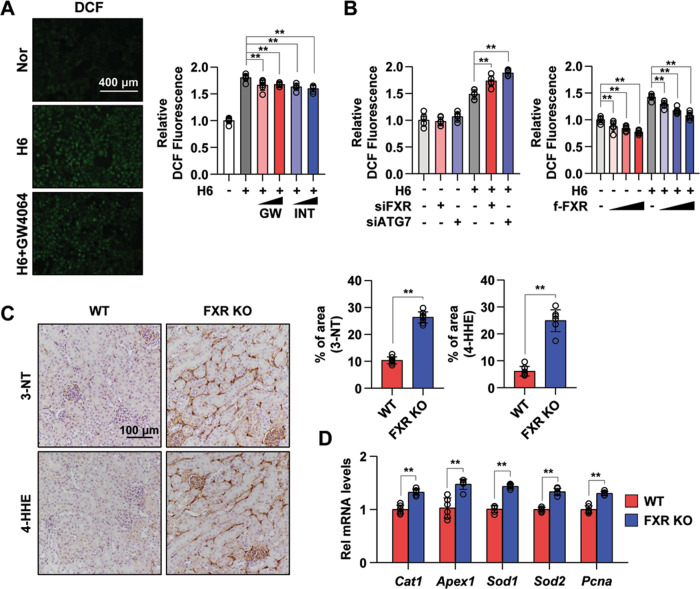
Fig. 6. FXR activation inhibits ROS production.
A After treatment with GW4064 (0.5 or 1 μM) or INT-747 (0.5 or 1 μM) for 1 h, HK2 cells were exposed to hypoxia for 6 h. The cells were labeled using CM-H2DCF-DA, and images were immediately visualized using the EVOS FL Auto Imaging System. Normoxic and hypoxia-exposed cells were incubated with CM-H2DCF-DA, and the ROS levels were measured using a Promega GloMax plate reader (right panel). The relative DCF fluorescence level is shown. The values for normoxia were set to 1 (n = 6). B HK2 cells were transfected with siFXR and siATG7 (left) or FXR expression plasmids (right) as indicated, and 48 h later, normoxic and hypoxia-exposed cells were incubated with CM-H2DCF-DA, and the ROS levels were measured. The values for normoxia of the siControl and vehicle were set to 1 (n = 6). C Paraffin-embedded kidney tissue sections from WT and FXR KO mice were stained with antibodies against 3-NT and 4-HHE (scale bar 100 μm). Computer-based morphometric analysis is shown (right bar graph, n = 7–8 in each group). D mRNA levels were detected by qRT-PCR (n = 6). All values are presented as the mean ± SD. Statistical significance was measured using one-way or two-way ANOVA with the Bonferroni post-test. *P < 0.05, **P < 0.005. 3-NT 3-nitrotyrosine, 4-HHE 4-hydroxy hexenal.

