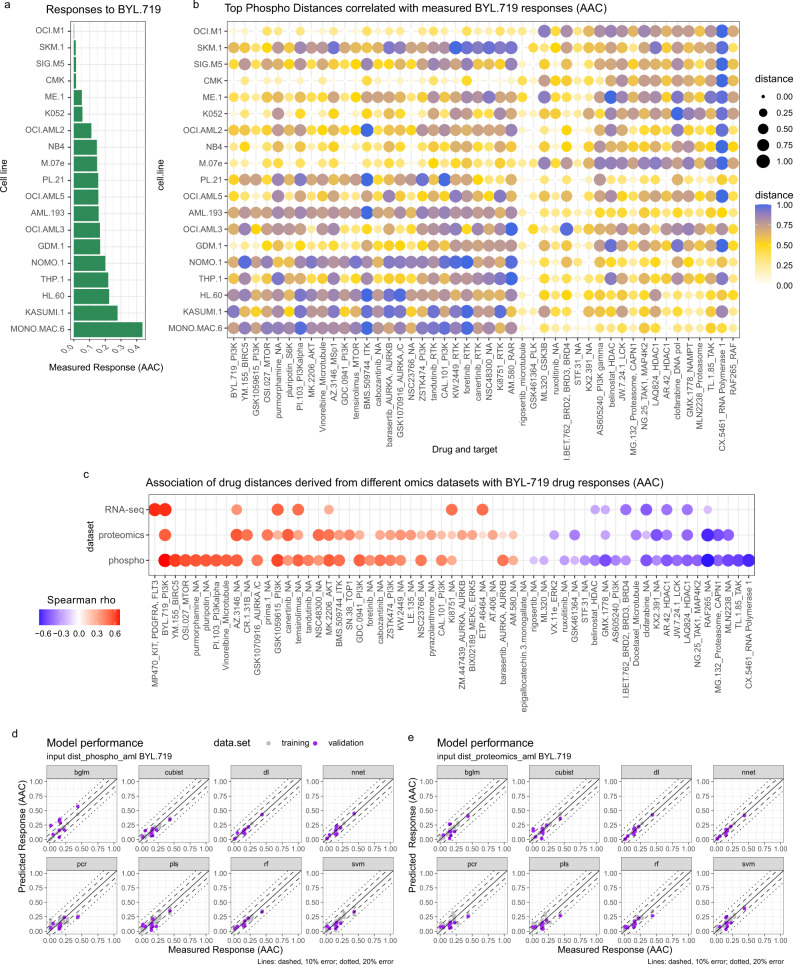
Fig. 2. Dimensionality reduction using empirical markers of drug responses.
a Barchart of average AML cell line sensitivity to BYL-719 (n = 19) rows are sorted in order of BYL-719 sensitivity (AAC). b Mean expression of top drug marker distance (D) values which correlate both positively and negatively with drug sensitivity to BYL-719 (2 tailed spearman correlation coeffiecient) in AML omics datasets (n = 19), measured in triplicate. Rows are sorted in order of BYL-719 sensitivity (AAC). Dot color intensities and sizes are proportional to distance values normalized 0–1. Rows in heatmap are ranked based on BYL-719 sensitivity; columns are ordered based on hierarchical clustering (complete with Euclidean distance). c Overall correlation of each distance marker with BYL-719 sensitivity; red values correlate with sensitivity whilst blue values correlate with resistance. Dot sizes are proportional to Spearman rho value. Columns in heatmap are ordered based on hierarchical clustering (complete with Euclidean distance). d Comparison of measured vs predicted responses retuned by the eight different learning methods using phosphoproteomics data as input. Solid, dashed and dotted lines signify 0%, 10% and 20% absolute error boundaries, respectively. e As in (d) but D values were obtained from proteomics data. Learning algorithms were random forest (rf), cubist, bayesian estimation of generalized linear models (bglm), partial least squares (pls), principal component regression (pcr), support vector machine (svm), deep learning (dl) and neural network (nnet).

