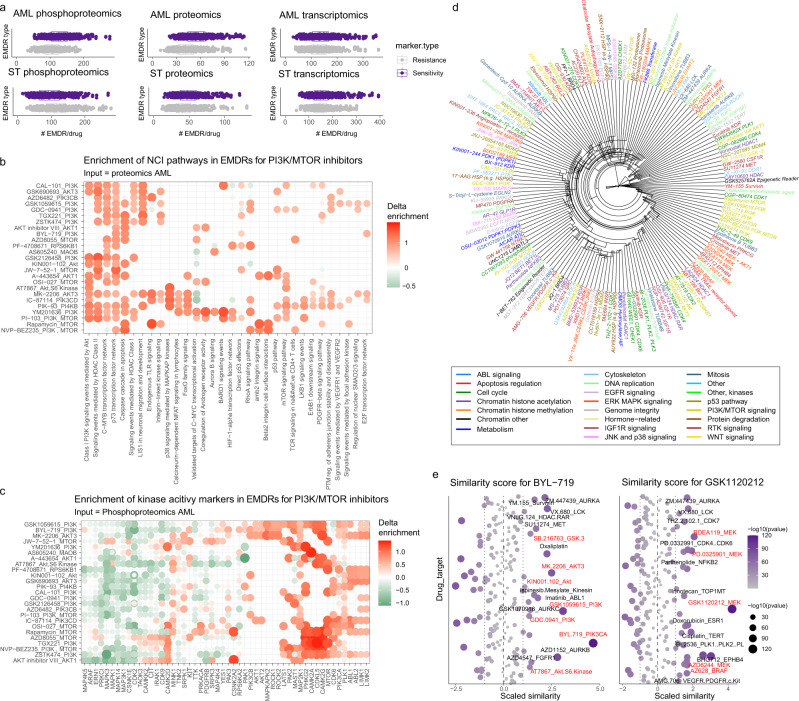
Fig. 3. Overview of systematic empirical markers of responses for >400 drugs.
a Total number of empirical sensitivity and resistance markers identified per drug in AML omics data (n = 26, measured in triplicate). Boxplots have median centers, interquartile box boundaries and range upper and lower hinges. Not all drugs were profiled in all cells cell lines; markers were successfully identified for 466 drugs with sufficient data points. b, c Mean enrichment of NCI pathways (b) and kinase activity markers (c) in EMDRs for PI3K/MTOR pathway inhibitors. Rows and columns in heatmap are ordered based on hierarchical clustering using Euclidean distances. Delta enrichment was calculated as the enrichment of the named pathway or kinase substrate set in EMDR increased in sensitive cells to a given drug minus the enrichment of the same pathways or kinase substrate in EMDRs increased in resistant cells. d Unsupervised clustering of delta enrichment values for all drugs with known targets (hierarchical clustering using Euclidean distances). e Drugs similar to BYL-719 and GSK1120212 (trametinib) as determined by similarity scores calculated from the Pearson correlation of pathway enrichment values between drug pairs. Pearson values were scaled and p values determined by comparing each similarity score value against the distribution of all values using one sample t-test.

