. 2019 Feb 20;39(2):302–314. doi: 10.5534/wjmh.180114

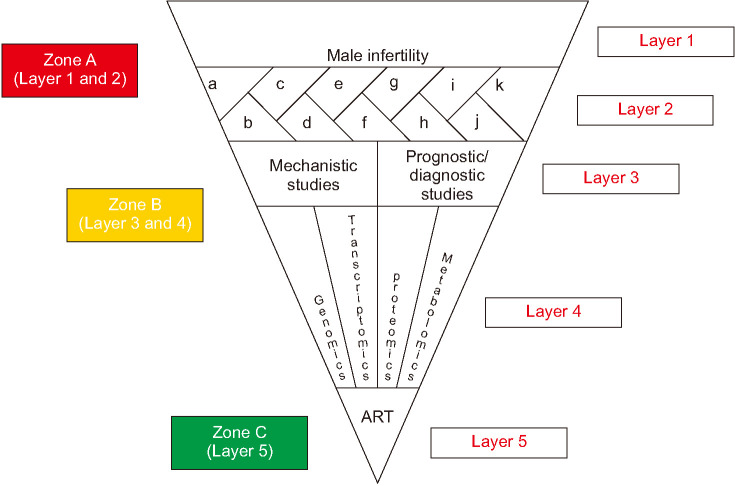
Fig. 1. Schematic representation of the Funnel Model. Layer 1 represents overall trend in male infertility research; Layer 2 is a sub-classification of Layer 1 having a (azoospermia), b (erectile dysfunction, ED), c (hypogonadism), d (lifestyle), e (male genital tract infection), f (obesity and Metabolic Syndrome, MetS), g (occupational exposure), h (oligozoospermia), i (testicular cancer), j (unexplained male infertility, UMI), and k (varicocele); Layer 3 represents mechanistic and prognostic/diagnostic studies of male infertility; Layer 4 represents omics (genomics, transcriptomics, proteomics, and metabolomics)-based publications in male infertility; Layer 5 represents assisted reproductive technology (ART)-based publications on male infertility. Zone A is comprised of Layer 1 and 2. Publications in zone A defines the problem; Zone B is comprised of Layer 3 and Layer 4. Publications in zone B helps in understanding the basis of the problem. Zone C comprised of Layer 5 and publications in this zone provide possible solution(s) to the problem.

Fig. 1