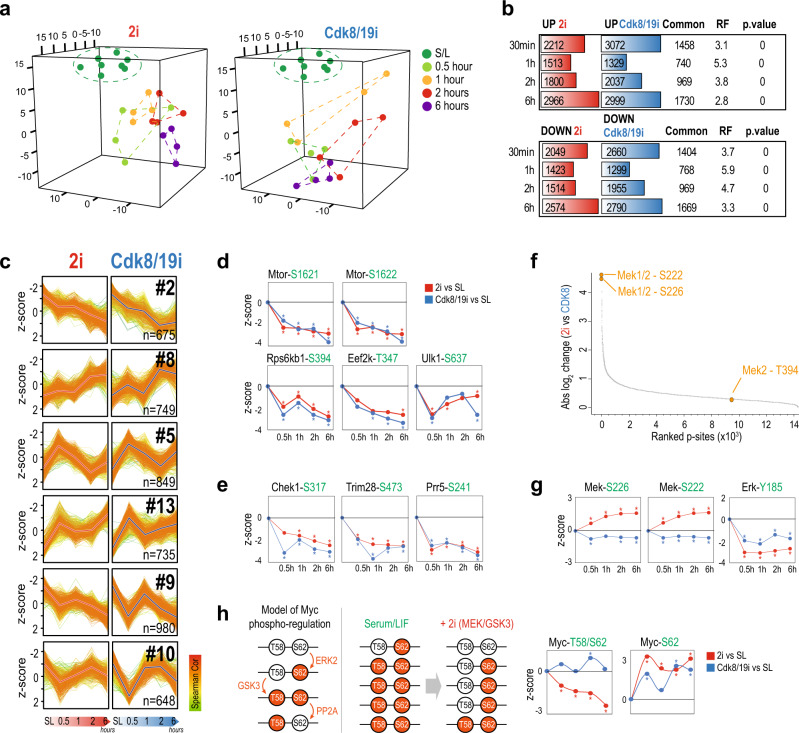
Fig. 6. Time-resolved phospho-proteomics in response to 2i or Cdk8/19i.
a Principal component analysis of the phospho-proteomes of cells treated with 2i or Cdk8/19i at different time points. b Differentially regulated p-sites using a moderated t-test (limma, two-sided, FDR < 5%) at the indicated time points. The number of common p-sites between 2i and Cdk8/19i is shown together with the corresponding p.values calculated with a hypergeometric test (RF indicates “Representation factor”). c Gap statistics and K-means classified the regulated phospho-proteome into 14 different clusters. Centroids are indicated with a thick red (2i) or blue (Cdk8/19i) line. Only six clusters are shown in the figure. The other 8 clusters are shown in Supplementary Fig. 5C. Color gradient in line plots indicates proximity to the centroid of the cluster. d Changes in p-sites of kinases involved in mTOR signaling in 2i or Cdk8/19i (n = 4 independent cell lines). Statistically significant changes using a moderated t-test (FDR < 5%) relative to reference S/L are indicated with an asterisk (p-value < 0.05). e Changes in phosphorylation of S317 regulatory site of Chek1 as well as two known Chek1 substrates (n = 4 independent cell lines). Statistically significant changes using a moderated t-test (FDR < 5%) relative to reference S/L are indicated with an asterisk (p-value < 0.05). f Ranked p-sites by their absolute difference between 2i and Cdk8/19i. Mek2 p-sites identified in our dataset are indicated. g Phosphorylation changes of Mek/Erk regulatory sites. Points indicate the average of n = 4 independent cell lines. Statistically significant changes using a moderated t-test (FDR < 5%) relative to reference S/L are indicated with an asterisk (p-value < 0.05). h Schematic model of Myc phospho-regulation in S/L and 2i. Changes in the T58/S62 di-phosphorylated Myc peptide and the S62 monophosphorylated are shown (n = 4 independent cell lines). Statistically significant changes using a moderated t-test (FDR < 5%) relative to reference S/L are indicated with an asterisk (p-value < 0.05). Source data for Fig. 6a are provided as Source Data file.

