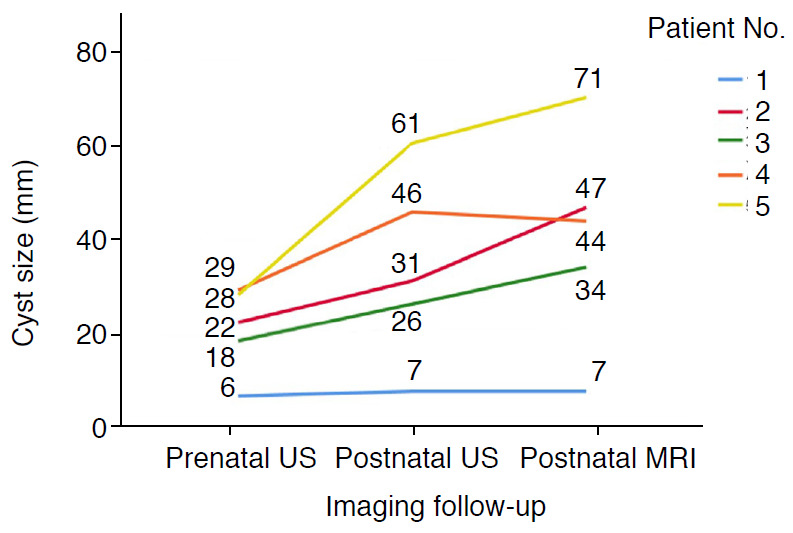
Fig. 3. Changes in cyst size from prenatal to postnatal imaging studies.

This spaghetti plot demonstrates changes in cyst size from initial prenatal ultrasonography (US), postnatal preoperative US, and magnetic resonance imaging (MRI) in the order of the routine clinical examinations. The numbers in the graph denote the cyst size. Patient number 1 was a case of cystic biliary atresia and the other four patients had choledochal cyst type Ia. The cyst size was smaller than 1 cm and stable during follow-up in the cystic biliary atresia case, but was larger than 1 cm and showed a growth trend in all cases of choledochal cyst.
