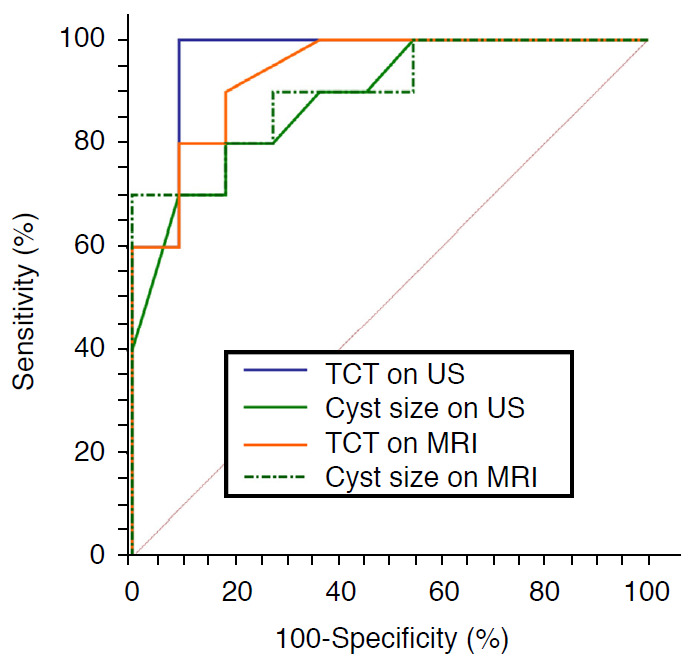
Fig. 4. Comparison of diagnostic performance between ultrasonography (US) and magnetic resonance imaging (MRI) parameters.

Receiver operating characteristic curves of triangular cord thickness (TCT) and cyst size on US and MRI show similar areas under the curve (AUC). The AUC is 0.964 (95% confidence interval [CI], 0.779 to 1.000) for US TCT, 0.886 (95% CI, 0.673 to 0.982) for US cyst size, 0.936 (95% CI, 0.739 to 0.996) for MRI TCT, and 0.900 (95% CI, 0.690 to 0.987) for MRI cyst size, without statistically significant difference (P>0.05).
