
Figure 7.
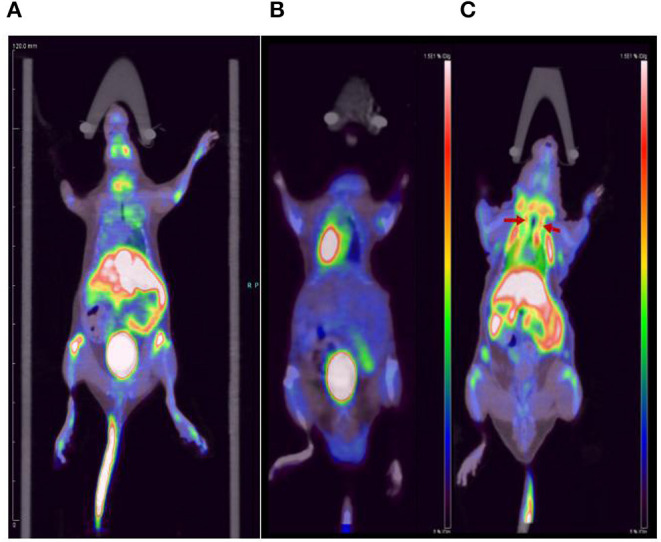
Comparison of (A) the normal mouse, (B) [18F]FDG carotid plaques imaging, and (C) [18F]YLF-DW carotid plaques imaging.
Official websites use .gov
A
.gov website belongs to an official
government organization in the United States.
Secure .gov websites use HTTPS
A lock (
) or https:// means you've safely
connected to the .gov website. Share sensitive
information only on official, secure websites.
Comparison of (A) the normal mouse, (B) [18F]FDG carotid plaques imaging, and (C) [18F]YLF-DW carotid plaques imaging.