Figure 1.
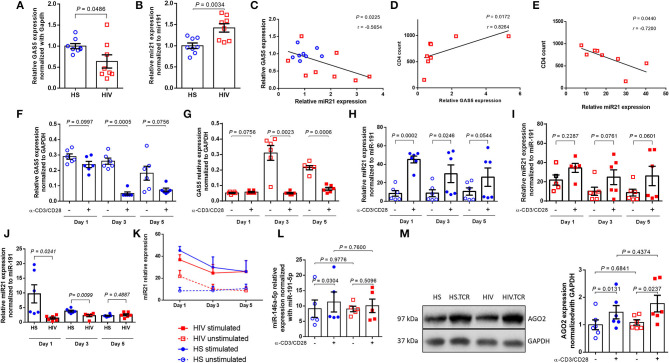
Differential expression of GAS5 and miR-21 in CD4 T cells after TCR stimulation. (A,B) Relative expression of GAS5 (n = 8) and miR-21 (n = 8) in CD4 T cells isolated from HS and PLHIV was determined by RT-qPCR. (C) Correlation between GAS5 and miR-21 expressions in CD4 T cells isolated from HS or PLHIV was determined by Pearson correlation analysis. (D,E) Correlation between CD4 T cell counts and relative GAS5 (n = 8) or miR-21 (n = 8) expressions in CD4 T cells from PLHIV was determined by Pearson Correlation analysis. (F,G) Relative expression of GAS5 in CD4 T cells from HS and PLHIV in the absence or presence of TCR stimulation for 1, 3, and 5 days (n = 6). (H,I) Relative expression of miR-21 in HS and PLHIV CD4 T cells with or without TCR stimulation for 1, 3, and 5 days (n = 6). (J) Relative expression of miR-21 in TCR-stimulated CD4 T cells from HS and PLHIV in 1, 3, and 5 days (n = 6). (K) Kinetic changes in miR-21 expression in CD4 T cells from both PLHIV and HS following TCR stimulation for 1, 3, and 5 days. (L) Relative expression of miR-146a in CD4 T cells from HS and PLHIV with or without TCR stimulation for 24 h (n = 6). (M) Representative dot blot and relative expression of AGO2 (a major component of RISK complex) in CD4 T cells from HS and PLHIV with or without TCR stimulation for 24 h, determined by Western blotting (n = 6).

