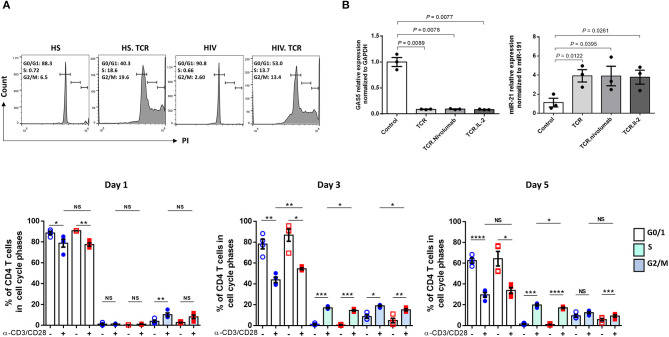
Figure 2.
Cell cycle progression, AGO2 expression, and effect of anti-PD1/IL-2 in TCR-stimulated CD4 T cells on GAS5-miR-21 axis. (A) Cell cycle progression in CD4 T cells from HS and PLHIV following TCR stimulation at day 1, 3, and 5 measured by PI flow cytometric analysis (n = 4). Representative histogram of cell cycle phases of CD4 T cells from HS and PLHIV with and without TCR stimulation at day 3 are shown above and summary data at day 1, 3, 5 are shown below. (B) Relative expression of GAS5 and miR-21 in CD4 T cells from HS and PLHIV following anti-PD1 and IL-2 treatments for 24 h, determined by RT-qPCR (n = 3). n.s, P > 0.05; *P ≤ 0.05; **P ≤ 0.01; ***P ≤ 0.001; ****P ≤ 0.0001.

