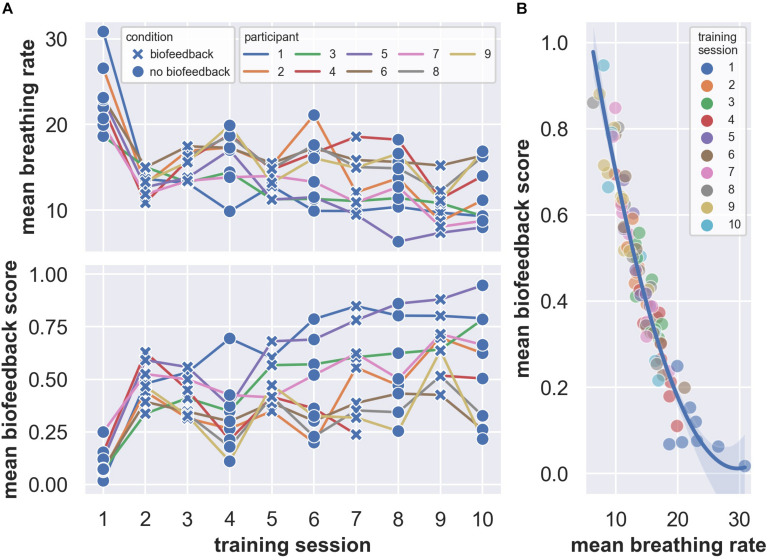
FIGURE 2.
Mean breathing rates (A, upper panel) and biofeedback scores (A, lower panel) over training sessions (alternating with and without biofeedback). (B) Quadratic fit characterizing the relationship of the session means of breathing rate and biofeedback score. The shaded region indicates a bootstrapped 95% confidence interval for the quadratic fit.

