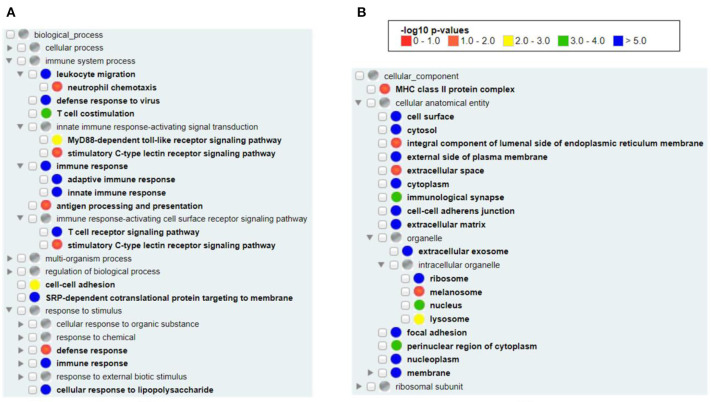
Figure 2.
GO enrichment analysis of all human vaximmutors. All available 1,675 human vaximmutors were extracted and analyzed using DAVID tool, and the enriched GO biological processes (A) and cellular components (B) were processed and visualized using GOfox. The p-value bar represented the color representation scheme of different adjusted p-value ranges. The cutoff was set as 0.05.

