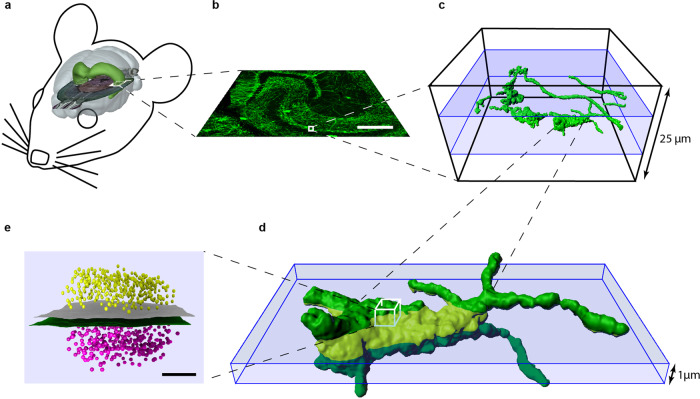
Fig. 1. Schematic overview for targeted imaging of hippocampal mossy fiber synaptic contacts.
a View of a virtual mouse brain with the dimensions of the hippocampal formation in green and a horizontal section from Allen Mouse Brain Atlas (image credit: Allen Institute for Brain Science, available from: http://mouse.brain-map.org/static/brainexplorer) to demonstrate the hippocampal region used for imaging (white box). b Confocal image of mossy fibers in a 25 µm thick hippocampal slice from a Thy1mEGFP(Lsi1) mouse. The white box marks again the region of interest (25 µm × 25 µm × 25 µm) that is shown magnified in the next panel. c 3D volume reconstruction of mEGFP in xyz-view, showing axons and mossy fiber boutons (green), a typical bouton with filopodial extensions is marked and further highlighted in d. The window (10 µm in z) for en bloc imaging in the 25 µm thick tissue block is shown in blue. d 3D volume reconstruction of a mossy fiber bouton. The light green area of the bouton shows the volume that would be captured using a typical 1 µm imaging depth in z for a single focal plane. The white box marks a virtual synaptic contact that is further magnified in the next panel. e A virtual synaptic contact in side view (presynaptic membrane in green, Bassoon clusters in magenta, Homer-1 in yellow, postsynaptic membrane in gray), scale bar in b 200 µm, in e 100 nm.

