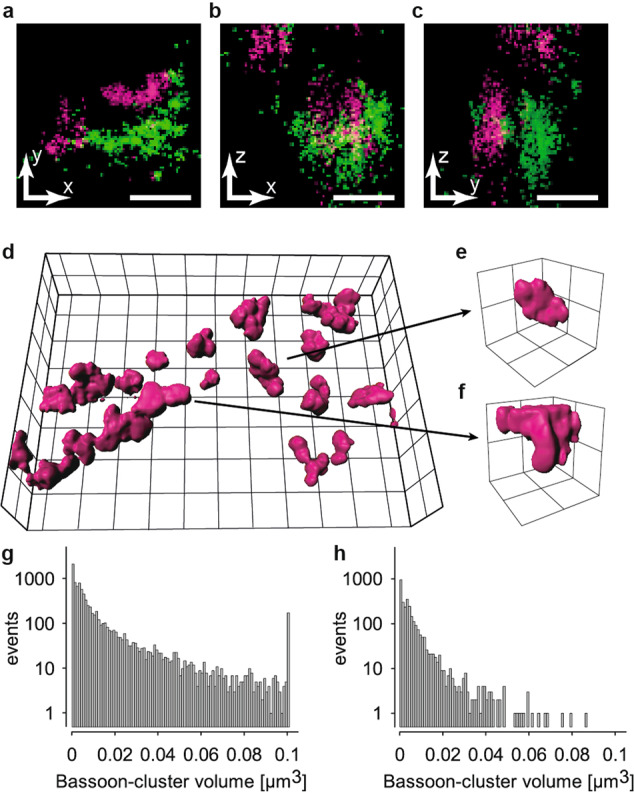
Fig. 3. 3D imaging uncovered truncation of Bassoon clusters.

a–c Representative two-color 3D dSTORM images of synaptic contacts with presynaptic Bassoon (green) and postsynaptic Homer 1 (magenta) in all three orientations (xy-view, xz-view, and yz-view; see Suppl. Video 1. d Volume reconstruction of a dataset of Bassoon. An entire cluster (e) within the imaged tissue volume, and a truncated cluster (f) extending beyond its upper edge are shown. Semi-logarithmic histograms of cluster volumes in seven images from 1 animal for all clusters (g, n = 8956) and for selected non-truncated clusters (h, n = 2925). Scale bars in a–c 100 nm, grid size in d 2 µm and in e, f 500 nm.
