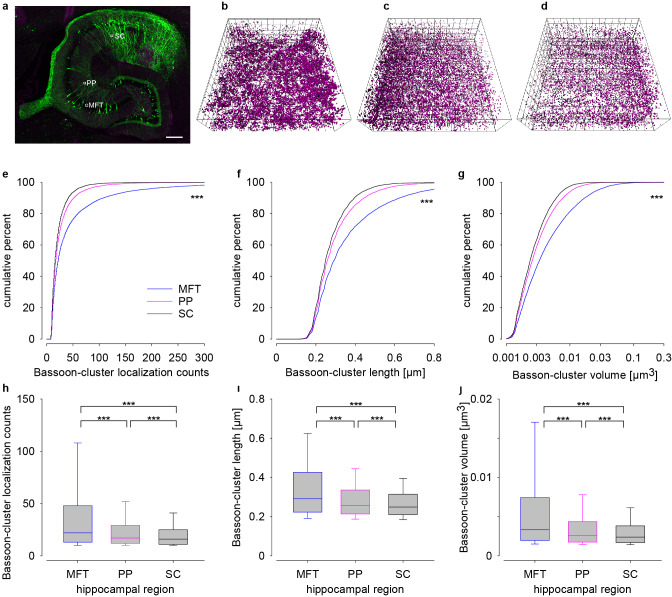
Fig. 4. En bloc 3D imaging in 25 µm thick tissue slice revealed different Bassoon patterns in three distinct hippocampal circuits.
a Confocal overview of a 25 µm thick section of the hippocampus in a Thy-1 EGFP(M) mouse with imaging windows in the mossy fiber tract (MFT), perforant pathway (PP), and Schaffer collaterals (SC) depicted to scale (25 × 25 µm). 3D plots of Bassoon clusters in MFT (b), PP (c), and SC (d). Cumulative plots of localization counts (e), cluster length (f), and volumes (g) in MFT (blue), PP (magenta), and SC (black). Corresponding data as box plots in h–j Scale bar: 200 µm in a and grid size 2 µm in b–d. Asterisks (***p < 0.001) denote statistical significance MFT vs. PP/SC and PP vs. SC.

