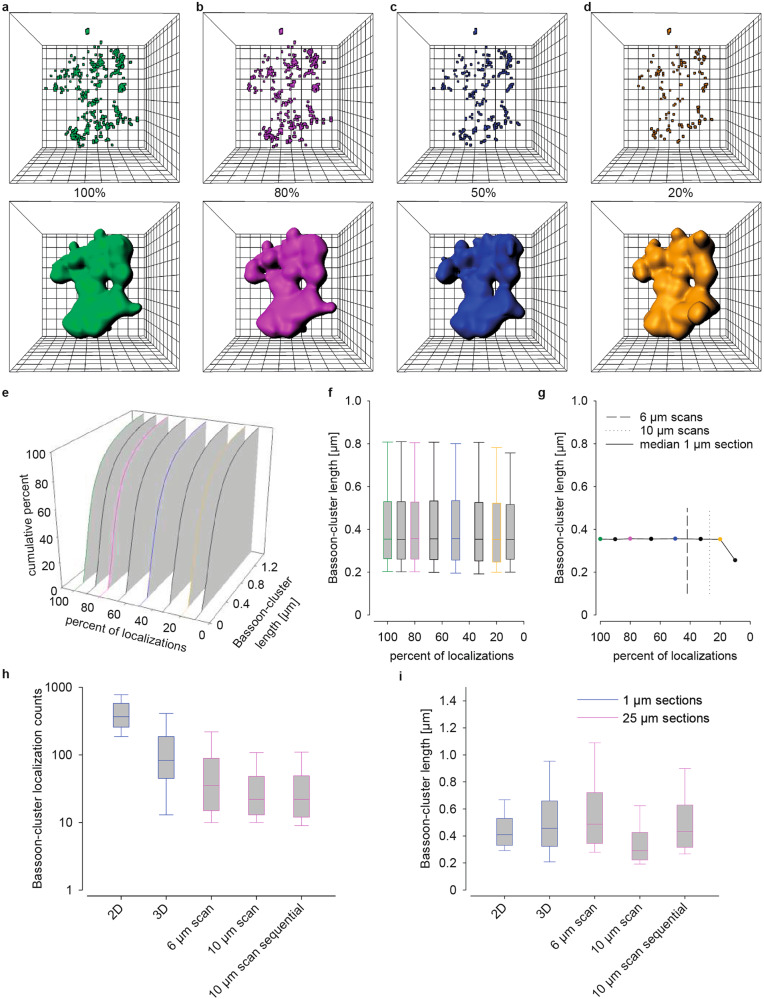
Fig. 6. Comparison of Bassoon cluster counts and length in the mossy fiber tract.
a–d Bassoon-cluster localizations (upper images) and their 3D volume reconstruction in a 1 µm scan and in artificial low-density data sets created by reducing counts to 80, 50, and 20% of the original counts. Mesh width: 0.1 µm (xyz). e 3D plot of cumulative histograms of Bassoon cluster length of all data sets. f Corresponding data as box plots. g Median values of all data sets plotted against degree of data reduction. Dashed lines indicate the corresponding relative localization density in en bloc scanning in 25 µm sections (see below in h) compared to 3D 1 µm sections. Bassoon cluster length remained nearly identical to the original data down to a reduction to 20% of the original localization counts, with no statistical difference between the data sets (Kruskal–Wallis ANOVA p = 0.07). h Bassoon-cluster localization counts in all imaging conditions. Localization counts decreased from 2D-imaging in 1 µm sections (median ± 25th–75th percentile; 367 ± 258–579) to 3D imaging in 1 µm sections (83 ± 45–187), scanning in 25 µm sections with a scan range of 6 µm (35 ± 15–89), 10 µm (22 ± 13–48) and sequential imaging (22 ± 12–49) highlighting stable length in repeated experiments. i Although localization counts per cluster decreased with scanning (and automated evaluation of Bassoon clusters) all imaging conditions gave comparable values of cluster length: 2D (0.41 ± 0.33–0.53 µm), 3D (0.46 ± 0.32–0.66 µm), 6 µm-scans (0.49 ± 0.34–0.721) and 10 µm scans (0.29 ± 0.22–0.43); 10 µm sequential (0.43 ± 0.32–0.63).

