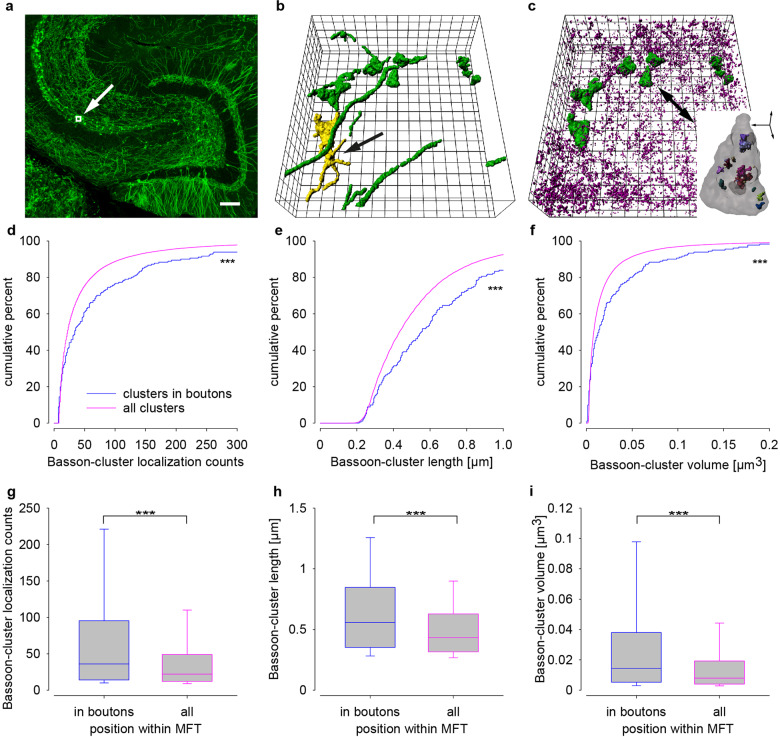
Fig. 7. Sequential en bloc 3D imaging in 25 µm thick tissue slices of mEGFP(Ls1) mice showed largest Bassoon clusters in identified mossy fiber boutons.
a Confocal overview of mossy fibers in a Thy-1 mEGFP(Ls1) mouse with imaging window (25 × 25 µm) depicted to scale. b 3D volume reconstruction of mEGFP in xyz-view, showing axons and mossy fiber boutons (green), a typical bouton with filopodial extensions is marked in yellow (black arrow). c 3D reconstruction of Bassoon (magenta) and mEGFP (green) in large mossy fiber boutons used for calculations of “clusters in boutons” in d–i; inset depicts the marked bouton (black arrow) with Bassoon clusters (colored). Cumulative plots of localization counts (d), cluster length (e), and volumes (f) comparing all clusters per image (magenta) and those in identified boutons (blue). Corresponding data as box plots g–i. Scale bar: 100 µm (a), grid size 2 µm (b, c) and scale bar for inset in c 1 µm. Asterisks (***p < 0.001) denote statistical significance between the groups.

