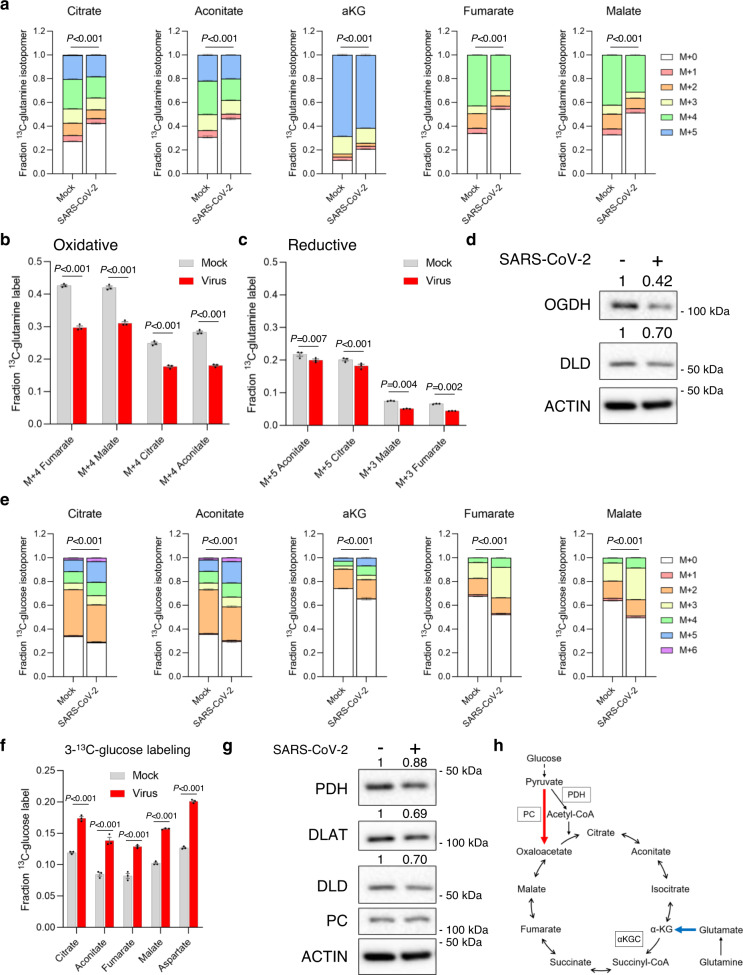
Fig. 1. SARS-CoV-2 infection alters TCA cycle metabolism.
a Glutamine entry into the TCA cycle is reduced in SARS-CoV-2 infected cells. Mass isotopomer analysis of TCA cycle metabolites in mock or SARS-CoV-2 infected Vero kidney epithelial cells after 24 h incubation with U-13C-glutamine. Each isotopomer is a different color, which is defined in the figure. P values compare the total fraction labeled between mock and SARS-CoV-2 infected cells (n = 3 biologically independent samples). b The oxidative TCA cycle is decreased in SARS-CoV-2 infected (red bars) Vero cells after 24 h infection compared with mock infected (gray bars) Vero cells (n = 3 biologically independent samples). c The reductive TCA cycle is maintained in SARS-CoV-2 infected (red bars) Vero cells compared with mock infected (gray bars) Vero cells after 24 h infection (n = 3 biologically independent samples). d Levels of αKGC members OGDH and DLD are reduced in SARS-CoV-2 infected Vero cells (representative of two biological independent samples). e Glucose-derived carbon entry into the TCA cycle is increased in SARS-CoV-2 infected cells. Mass isotopomer analysis of TCA cycle metabolites in mock or SARS-CoV-2 infected Vero kidney epithelial cells after 24 h incubation with U-13C-glucose. Each isotopomer is a different color, which is defined in the figure. P values compare the total fraction labeled between mock and SARS-CoV-2 infected cells (n = 3 biologically independent samples). f Glucose-derived carbon entry into the TCA cycle using PC is increased in SARS-CoV-2 infected cells. Fraction of labeled metabolites in mock (gray bars) or SARS-CoV-2 infected (red bars) Vero cells after 24 h incubation with 3-13C-glucose (n = 3 biologically independent samples). g Levels of PDH complex members are decreased in SARS-CoV-2 infected Vero cells (representative of two biological independent samples). h Schematic of the changes in TCA cycle metabolism in SARS-CoV-2 infected cells. Glutamine entry is reduced (blue arrow) and pyruvate entry using PC is increased (red arrow). Unless indicated, data are the mean ± s.e.m. and P values were obtained by two-way ANOVA with Sidak’s multiple comparison test.

