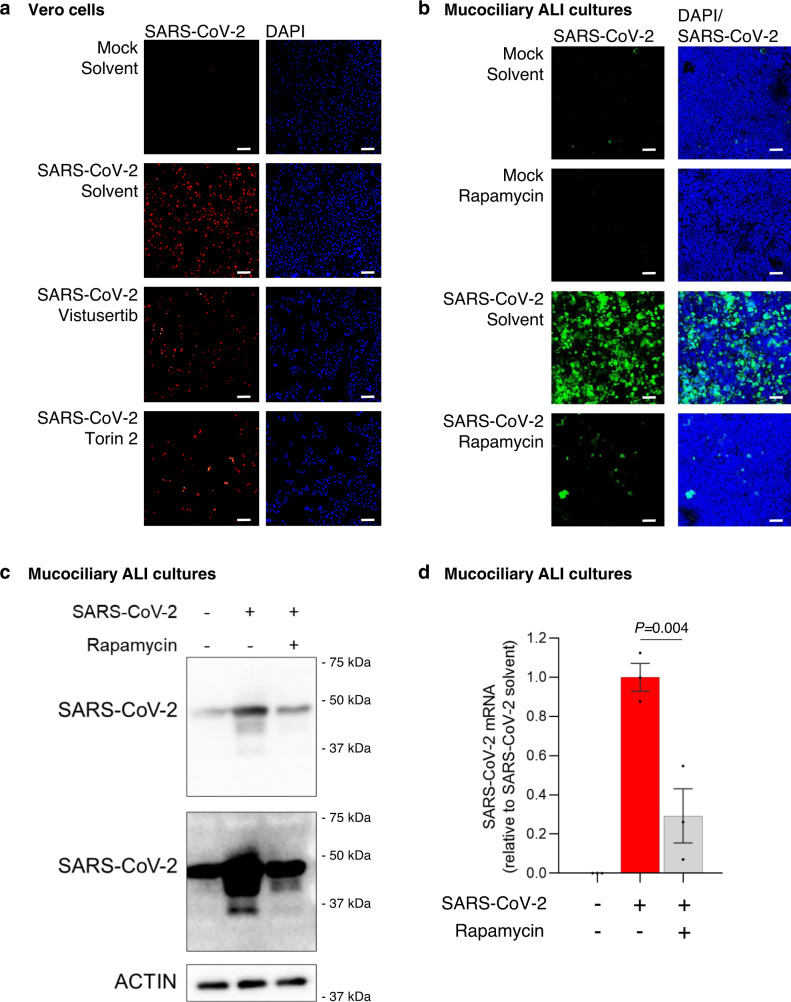
Fig. 3. mTORC1 inhibitors reduce SARS-CoV-2 replication.
a mTORC1 inhibitors reduce SARS-CoV-2 levels in Vero kidney epithelial cells. Immunofluorescence of cells infected with SARS-CoV-2 and treated with 25 nM of the indicated non-FDA approved mTORC1 inhibitors for 72 h. Cells were stained for dsRNA (red) to show SARS-CoV-2 levels. DAPI (blue) stained the nuclei of the Vero cells (n = 3 biologically independent samples). b The FDA-approved mTORC1 inhibitor rapamycin reduces SARS-CoV-2 levels in NHBE ALI mucociliary cultures. Immunofluorescence of cells infected with SARS-CoV-2 and treated with 1 µM rapamycin for 48 h. Cells were stained with an anti-SARS coronavirus antibody (green) to show SARS-CoV-2 levels. DAPI (blue) stained the nuclei of the mucociliary cells (n = 3 biologically independent samples). c FDA-approved mTORC1 inhibitors reduce SARS-CoV-2 protein expression. NHBE ALI cultures were infected with SARS-CoV-2 and treated with 1 µM rapamycin. Protein was extracted after 48 h and immunoblotted with an anti-SARS coronavirus antibody to determine SARS-CoV-2 protein expression. Multiple exposures of SARS-CoV-2 antibody are shown (representative of three biological independent samples). d FDA-approved mTORC1 inhibitors reduce SARS-CoV-2 gene expression. NHBE ALI cultures were infected with SARS-CoV-2 (red bar) and treated with 1 µM rapamycin (gray bar). RNA was extracted after 48 h and SARS-CoV-2 N gene expression quantified relative to RPLP0 using qPCR. Data are normalized to SARS-CoV-2 solvent cells (n = 3 biologically independent samples. Data are mean ± s.e.m. and P values were obtained by one-way ANOVA with Tukey’s multiple comparison’s test). Scale bar 30 µM.

