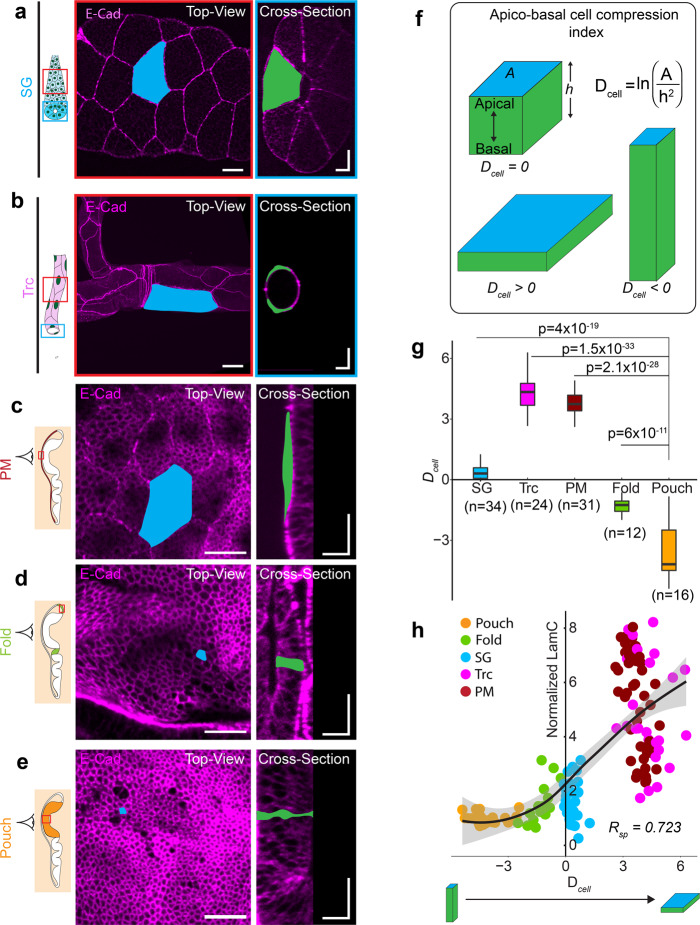
Fig. 2. Lamin C scales with apico-basal cell compression in epithelial tissues.
Schematic representation of the salivary gland (a) and trachea (b) with the region imaged marked by the red and blue ROIs. Images show the top view (red ROI) and cross-section view (blue ROI) of the SG and trachea expressing E-CadGFP (magenta). A representative cell is shown with apical area marked in blue and apico-basal area marked in green. Scale bar in top-view images in (a) and (b), 25 µm. Scalebar in cross-section images, 25 µm along both axes. c–e Cell morphology in different regions of the wing disc. PM of the wing disc is colored in dark red (c). The fold is colored in light green (d), and the pouch is colored in orange (e). Images show the top view and cross-section view of each wing disc region expressing E-CadGFP (magenta). A representative cell is shown with the apical area marked in blue and apico-basal area marked in green. Scale bar in top-view images, 15 µm. Scale bar in cross-section images, 15 µm along both axes. f Schematic representation of cell deformation index (Dcell) for epithelial tissues. Dcell for a cube is 1, whereas Dcell for a cuboid elongated along the apico-basal axis is <1 and a cuboid compressed along the apico-basal axis is >1. g Box-plot of Dcell for different epithelial tissues of Drosophila. The sample number, n represents the number of cells analyzed across 10 different tissue samples. h Scatter plot between Dcell and normalized levels of LamC. Each point in the scatter plot represents an individual cell in different Drosophila tissues. Solid black line represents the LOESS regression of the data. The Spearman rank correlation coefficient, Rsp is 0.723. P values are estimated by one-way ANOVA and the p values are shown for comparison with the Dcell value in the pouch.

