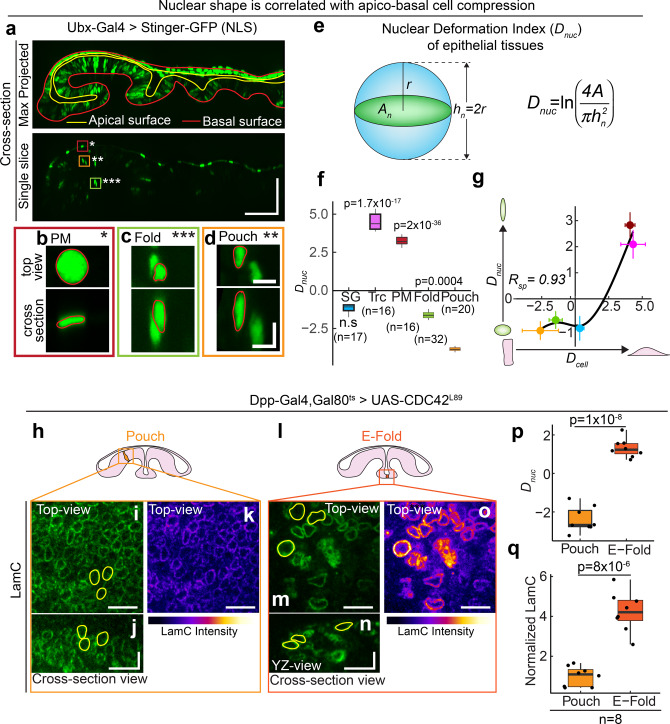
Fig. 5. Apico-basal cell compression regulates Lamin A/C levels via prolate to oblate deformation of the nucleus.
a Cross-section view of the wing disc expressing nuclear NLS protein Stinger-GFP driven by Ubx-Gal4. Upper panel shows the maximum projected image of Stinger-GFP. Solid red line shows the basal surface of cells, and solid yellow line shows the apical surface of cells. Scale bar along both axes, 50 µm. Enlarged images of regions where PM is marked by dark-red ROI and single asterisk (b), fold by green ROI and triple asterisk (c), and pouch by orange ROI and double asterisk (d). For each region, the upper panel shows the top-view of the nucleus, and lower panel shows the cross-section of the nucleus. Solid red line shows the outline of the nucleus. Scale bar along both axes, 5 µm. e Schematic showing the estimation of nuclear deformation index (Dnuc) for a nucleus. f Box-plot showing Dnuc for different Drosophila tissues. The sample number, n represents the number of nuclei analyzed across 10 tissue samples. g Scatter plot between Dcell and Dnuc in Drosophila tissues—SG (light blue), Trc (Magenta), PM (dark red), Fold (light green) and Pouch (orange). Data are presented as mean ± S.D. The Spearman’s rank correlation coefficient, Rsp is 0.93 with FDR of 0.049. Solid black line represents the LOESS regression to the data. h Schematic showing an elongated cell in the wing pouch. i XY-view of the LamC image. Equatorial area of three representative nuclei is marked by yellow outlines. j Cross-section view of LamC in pouch. YZ cross-sectional area of three representative nuclei is marked by yellow outlines. k Color-coded image showing the intensity of LamC in the pouch nuclei. l Schematic showing an apico-basally compressed cell in the ectopic fold. m XY-view of the LamC image. Equatorial area of three representative nuclei is marked by yellow outlines. n Cross-section view of LamC in pouch. YZ cross-sectional area of three representative nuclei are marked by yellow outlines. o Color-coded image showing the intensity of LamC in the pouch nuclei. Scalebar, 10 µm in vertical and horizontal directions. p Box-plot showing Dnuc for pouch and E-fold nuclei. q Box-plot showing the normalized LamC levels in Pouch and E-fold nuclei. Normalization is performed against LamC levels in the pouch. Sample number n represents the number of wing discs analyzed. The p values are estimated by two-sided Student’s t-test and the p values are indicated in the respective plots. P values in (f) are shown for comparison with the Dnuc for the pouch. In the box-plot, horizontal line represents the median of the data, lower and upper bounds of the box represent the 25th and 75th percentile of data, and the whiskers represent the minimum and maximum of the data. The scattered point on the box represents the actual data points. The scattered point on the box represents the actual data points.

