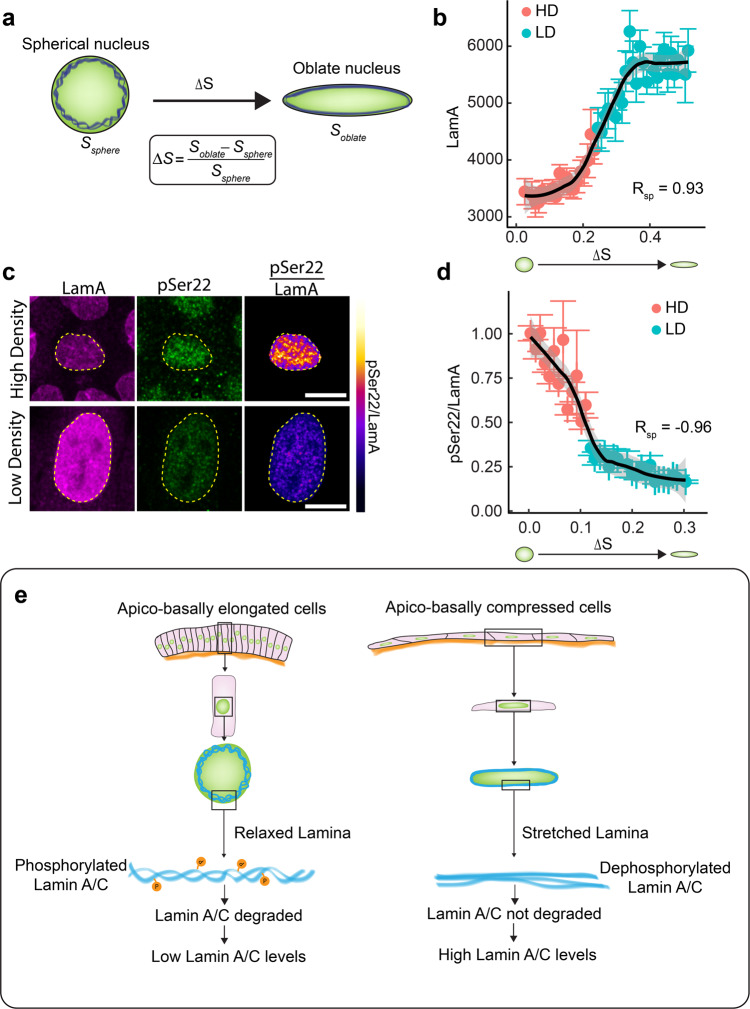
Fig. 7. Lamina network stretching induced dephosphorylation of Lamin A/C regulates Lamin A/C levels in epithelial tissues.
a Schematic showing the stretching of nuclear lamina (blue) when a sphere is compressed to an oblate spheroid. The surface area strain, represented by ΔS is the change in surface area of the oblate spheroid as compared to the surface area of the sphere. b Binned scatter plot between Surface area strain (ΔS) and Lamin A generated by binning ΔS in bins of 0.01. Each point in the plot represents the mean value of ΔS and LamA in the bin. The red points represent data from HD culture and cyan points represent data from LD culture. Solid black line shows the LOESS regression to the data. Spearman’s rank correlation coefficient between ΔS and LamA Rsp is 0.93. c Images showing Lamin A(magenta), pSer22 (green) and pSer22/LamA ratio (color-coded) in cells plated in high density (top panel) or low density (bottom panel). Scale bar, 10 µm. d Binned scatter plot between surface area strain (ΔS) and pSer22/LamA generated by binning ΔS in bins of 0.01. Each point in the plot represents the mean value of ΔS and pSer22/LamA in the bin. The red points represent data from HD culture and cyan points represent data from LD culture. Spearman’s rank correlation coefficient between ΔS and pSer22/LamA, Rsp is −0.93. Solid black line shows the LOESS regression to the data. Data are presented as mean values ± S.E.M. e A model elaborating the apico-basal cell compression mediated regulation of Lamin A/C in epithelial tissues.

