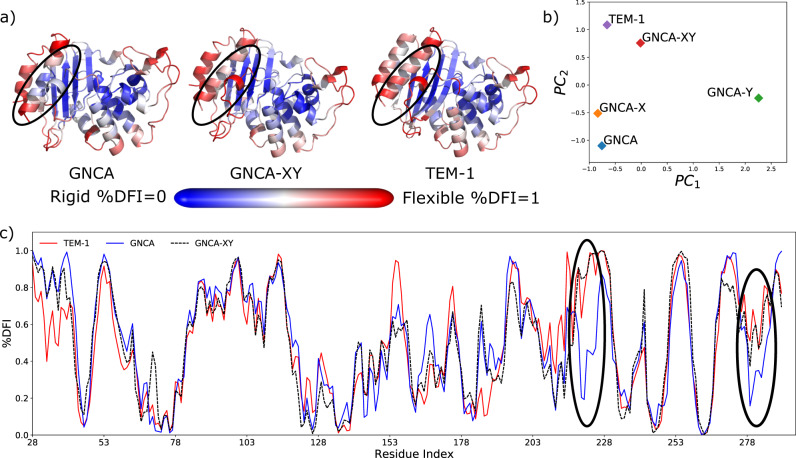
Fig. 3. The similarities in the flexibility profiles of GNCA-XY mutants compared to the wild-type GNCA and TEM-1 β-lactamase.
a Color-coded DFI profiles mapped onto the 3D structure where red is flexible and blue is rigid, b clustering of these profiles using principal component analysis (PCA), c the plot of mapped DFI profiles per residue position for each protein. The PCA analysis shows that GNCA-XY is similar to TEM-1 β-lactamase as shown in the principal component biplot. GNCA-XY mimics the flexibility profile of TEM-1 β-lactamase more closely than mutation sets X and Y alone, particularly around residues 220 and 280 (highlighted) in panel (c), also seen in their cartoon representations color-coded with the flexibility profile of their residues, red being flexible and blue rigid. The computed data are provided as a Source Data file.

