Figure 1.
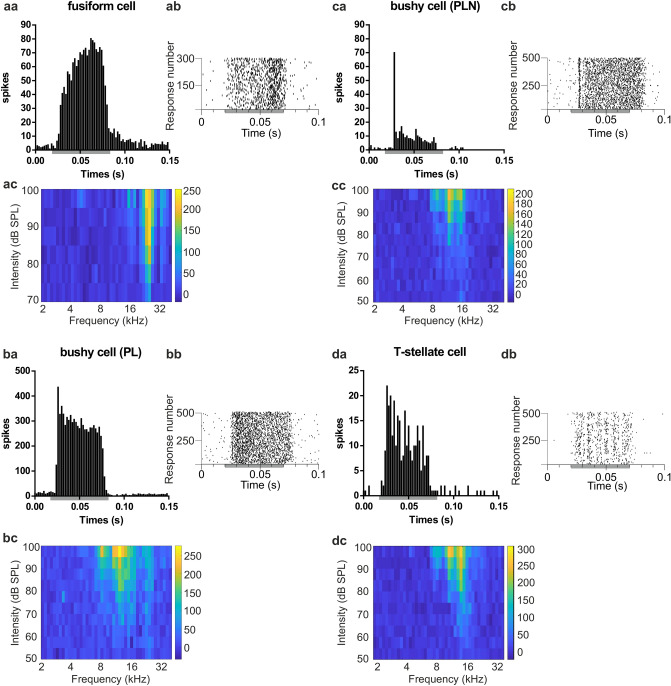
Cell classification. The neurons recorded in the cochlear nucleus were classified based on their characteristic response profile. (aa) Post-stimulus time histogram (PSTH, 2 ms bin, 300 sweeps) of a spike-sorted unit from a fusiform cell in DCN recorded during best-frequency tone stimulation (24,261 Hz) at 20 dB above threshold. The PSTH shows the characteristic build-up response. (ab) Raster plot of the fusiform cell from aa. (ac) Receptive field (frequency intensity response pattern; colour code is spike rate in 50 ms from 10 sweeps) for the same fusiform cell. (ba) PSTH (2 ms bin, 500 sweeps) of a spike-sorted unit from a primary-like bushy cell (PL) in VCN recorded during best-frequency tone stimulation (12,130 Hz). (bb) Raster plot of the primary-like bushy cell from ba. (bc) Receptive field (colour code is spike rate in 50 ms from 10 sweeps) for the primary-like bushy cell in ba. (ca) PSTH (2 ms bin, 500 sweeps) of a spike-sorted unit from a primary-like-with-notch bushy cell (PLN) in VCN, recorded during best-frequency tone stimulation (10,560 Hz). (cb) Raster plot of the PLN bushy cell from ca. (cc) Receptive field of the primary-like bushy cell with notch. (da) PSTH (2 ms bin, 500 sweeps) of a spike-sorted unit from a t-stellate cell in VCN, recorded during best-frequency tone stimulation (14,934 Hz). (db) Raster plot of the spike-sorted t-stellate cell from da. (dc) Receptive field (colour code is spike rate in 50 ms from 10 sweeps) for the t-stellate cell. In the panels showing PSTH and raster plots, the grey bar is the 50 ms tone stimulation.

