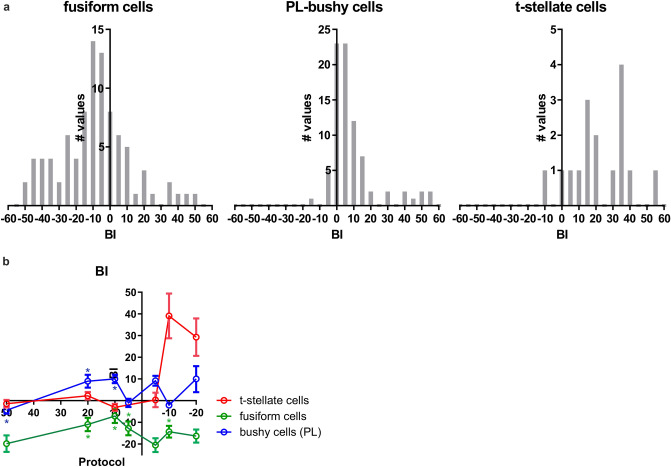
Figure 6.
Bimodal integration index. (a) Histograms of the BI (bimodal integration index) for bimodal protocols where the spiking was increased compared to only sound stimulation. In fusiform cells, and primary-like bushy cells the BIs for the + 20 & + 10 protocols are plotted. For the t-stellate cells the − 20 and − 10 protocols. Two values for each cell, one for each of the two protocols. (For the t-stellate plot, four values with a BI > 60 are not included in the plot.) (b) The BI (mean ± SD) for all recorded protocols in fusiform cells, primary-like bushy cells and t-stellate cells. * in the corresponding colour mark the protocols where there was a significant difference in spiking activity between bimodal and sound stimulation.

