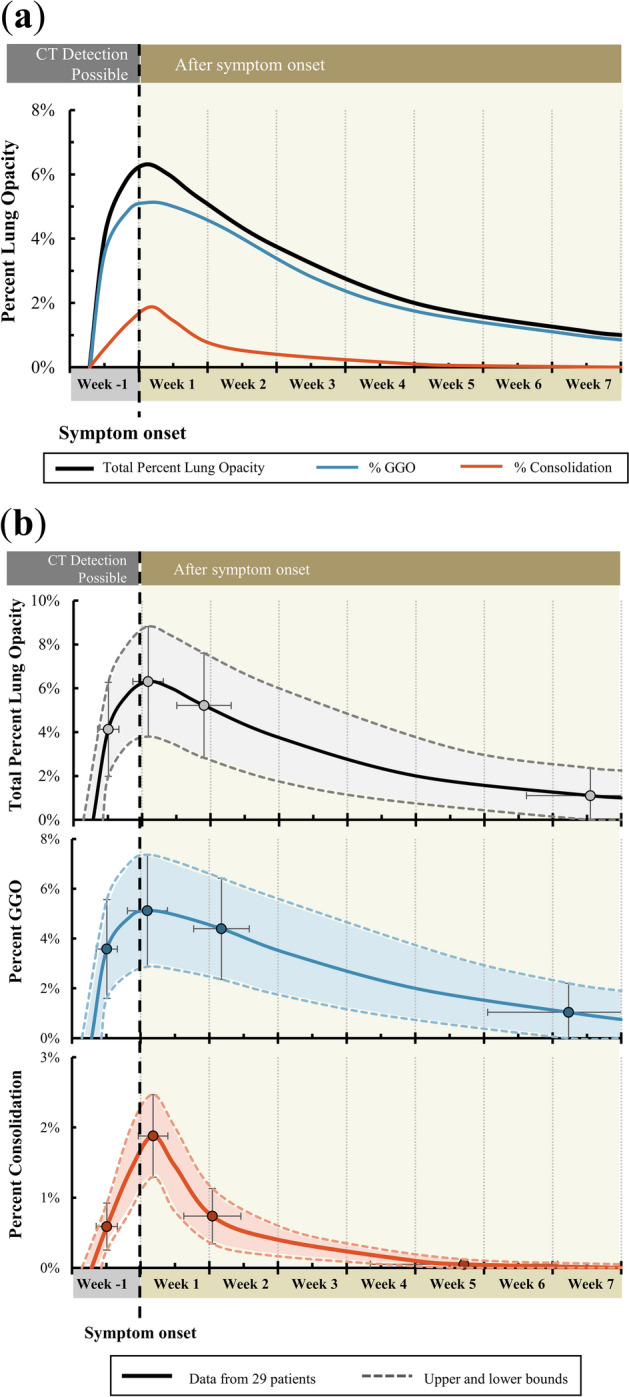
Figure 2.

Dynamic curves of percent lung opacities for initially asymptomatic patients with COVID-19. (a) COVID-19 lung opacities, generalized from 29 patients with sequential CTs. Percent COVID-19 lung involvement (black) and opacity subtypes, including GGO (blue) and consolidation (red) are shown. (b) Detailed curves showing total percent COVID-19 lung opacity and subtype (GGO and consolidation). The upper and lower bounds and error bars represent the standard deviations. Data points are shown at the 4 generalized time points where percent lung involvement was calculated and estimated.
