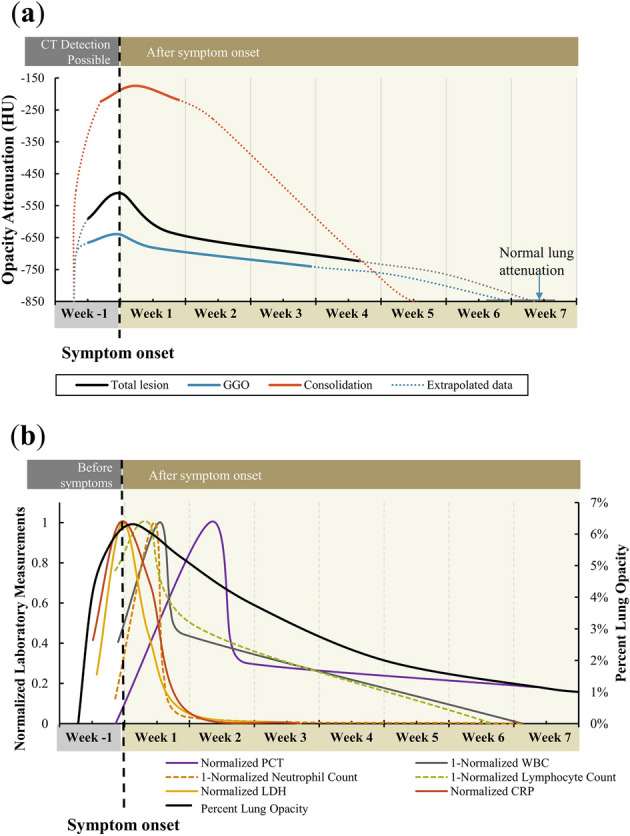
Figure 4.

Dynamic curves of lesion attenuation and laboratory measurements. (a) Dynamic curves for COVID-19 lesion attenuation or density. The total lesion attenuation (black) and subtypes (GGO = blue, consolidation = red) are shown overtime and were generalized from 29 patients with sequential CTs. The dotted lines show the data extrapolated to normal lung attenuation. (b) Dynamic laboratory measurements over time for COVID-19-positive patients. The generalized and normalized curves for PCT (purple), 1-WBC (gray), LDH (yellow), CRP (red) with total percent lung involvement (black).
