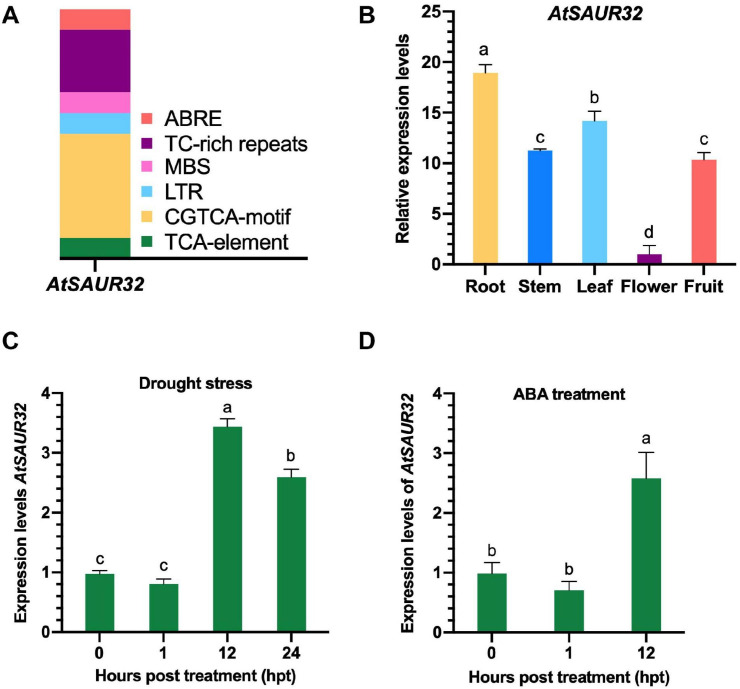
FIGURE 1.
Transcriptomic and qRT-PCR analysis of AtSAUR32 gene. (A) Cis-regulatory elements involved in the stimulation of AtSAUR32 used 1.5 k upstream region and analyzed by the online tool PlantCARE. (B) The tissue-specific expression levels of AtSAUR32 (Arabidopsis plants were grown under normal condition) were examined using qRT-PCR. (C) The expression pattern of AtSAUR32 under drought treatment performed by qRT-PCR analysis. (D) The expression pattern of AtSAUR32 under ABA treatment, examined by qRT-PCR. Mean values and standard deviation (+SD) are plotted as analyzed by Duncan’s multiple range (DMR) test (P < 0.05); lowercase letters (a–d) indicate significant difference.

