Figure 1.
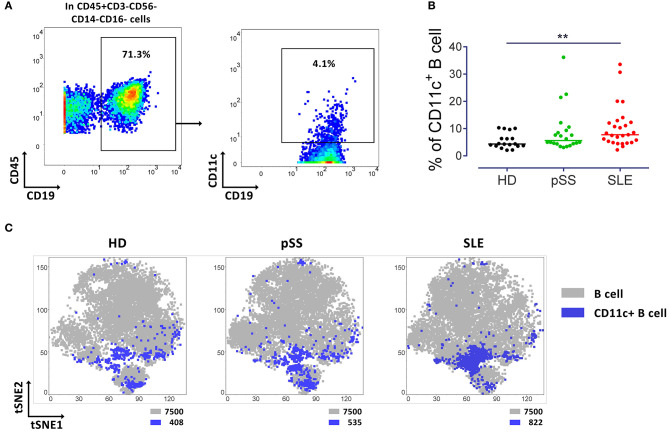
Increased CD11c+ B cells in SLE patients. (A) Representative pseudocolor plots of B cells (left) and CD11c+ B cells (right) from a control (HD). (B) Median of frequency of CD11c+ B cells from 18 HD, 22 pSS and 27 SLE patients, each point represents a donor. Kruskal-Wallis test with Dunn's post-test. **p < 0.01. (C) t-SNE plots of CD11c+ B cells (Blue) and general B cell (gray) populations. t-SNE was performed from concatenated file composed from 15 HD, 15 pSS and 15 SLE (7,500 events per group). Number of events of CD11c+ and B cells are indicated for each t-SNE plot.

