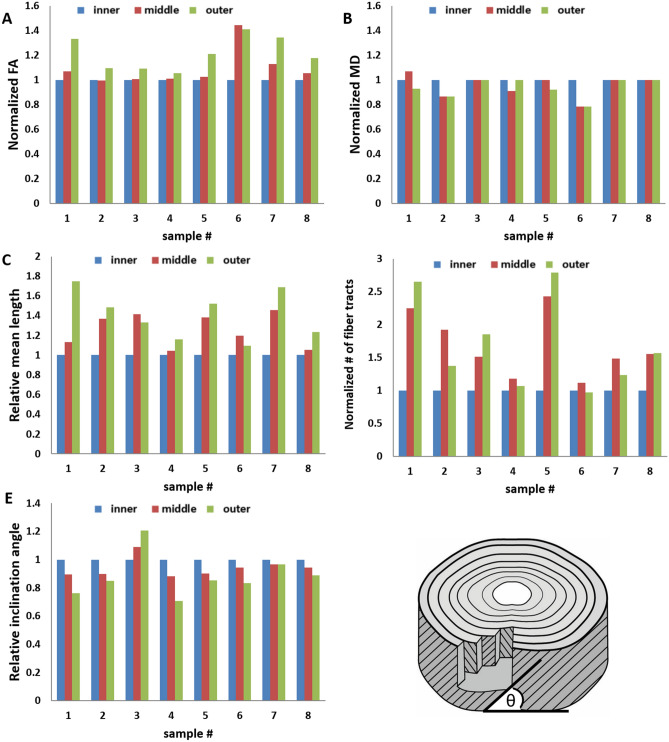
Figure 4.
Diffusion and morphological parameters for the eight samples, normalized to the inner aspect. FA tends to increase from the inner to the outer region (A), whereas MD shows only a little variation among the regions (B). The mean fiber tracts’ length in each of the three regions after normalization to the length of the inner region (C). The inner region has the lowest fiber tract length throughout all the samples. In six out of the eight samples, the outer aspect of the disc has the largest mean fiber tract length. The number of fiber tracts found is higher in the outer region in four samples and is higher in the middle region in four other samples (D). The peaks of the axial inclination angle to the axial plane from the disc surface follow a steady pattern in seven out of the eight samples scanned, in which the highest peak appears in the inner region and decreases from there toward the outer aspects of the disc (E). P value < 0.001 between any two regions tested for each sample (t test), apart from MD differences, which did not show significant variations between regions.

