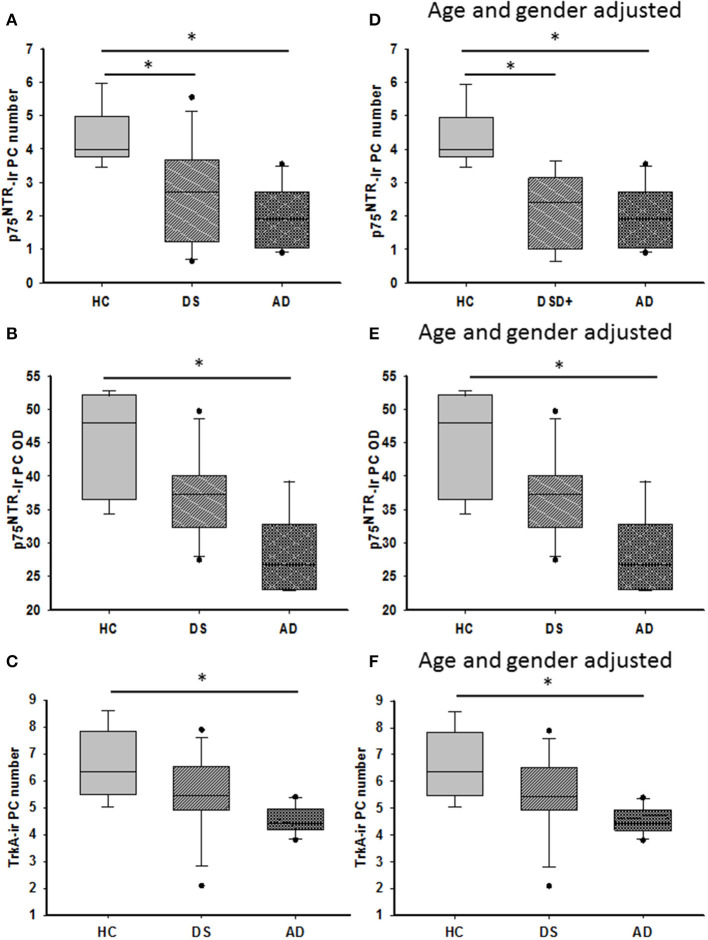
Figure 11.
Boxplots showing a significant reduction in the number of p75NTR positive PCs in both DS (A; Kruskal–Wallis, p = 0.03) and AD (A; Kruskal–Wallis, p = 0.001) compared to HC. Adjusting for age and gender revealed statistically similar results when DSD– cases were removed from the analysis (D; ANCOVA, p < 0.011). Optical density (OD) measurements of p75NTR-ir PC soma revealed significantly higher values in HC compared to AD (B; Kruskal–Wallis, p = 0.009) but not different from subjects with DS. Similar statistical findings were found when adjusted for age and gender (E; ANCOVA, p < 0.011). Boxplots revealed a significant reduction in the number of TrkA-ir PCs in AD compared to HC but not in DS (C; Kruskal–Wallis, p < 0.05) even after adjusting for age and gender (F; ANCOVA, p < 0.001). * denotes significance between groups.

