
Figure 13.
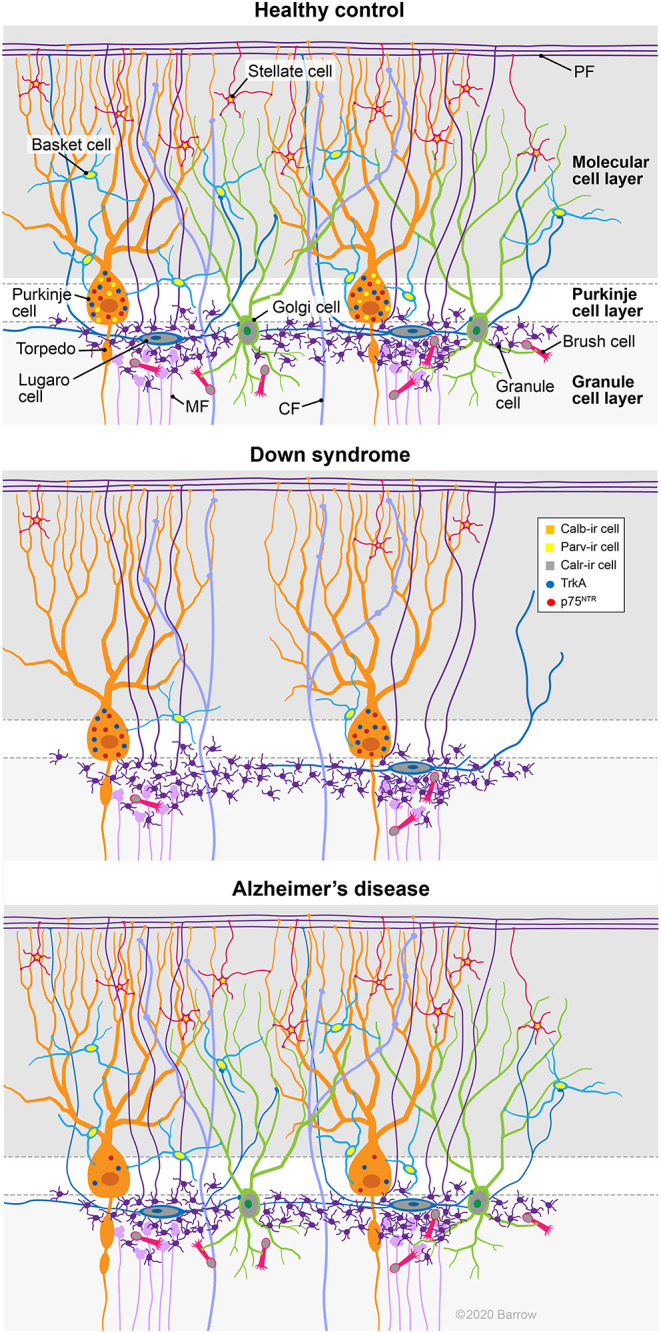
Summary diagram depicts cellular alterations in DS and AD compared to HC cases. Note the reduction of Parv containing PCs as well as Parv (basket/stellate) and Calr (Golgi, Lugaro, and brush) positive interneurons in the cerebellar cortex of an adult with DS. By contrast, TrkA and p75NTR-ir PC numbers were lower in AD compared to HC, but not in DS. CF, climbing fibers; MF, mossy fibers; PF, parallel fibers. Used with permission from Barrow Neurological Institute, Phoenix, Arizona.