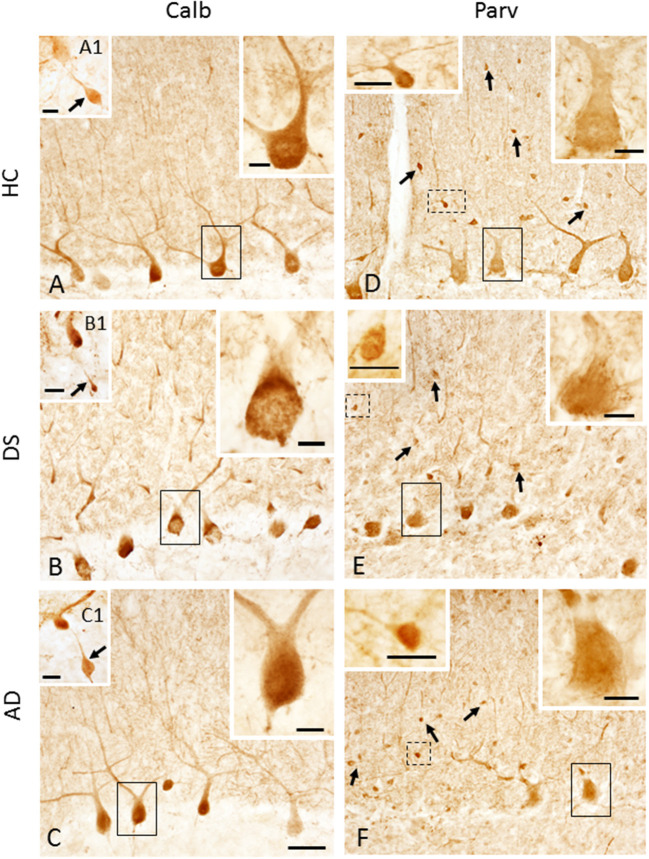
Figure 7.
Photomicrographs showing Calb-ir PCs in a 66-year-old female HC (A), 47-year-old female with DSD– (B) and a 72-year-old female with AD (C) case. Upper right insets show high-power image of the black outlined Calb-ir PCs shown in (A–C). Insets (A1–C1) show GL Calb-ir axonal torpedoes (arrows) in a 51-year-old male HC (A1), 60-year-old female with DSD– (B1) and a 79-year-old female with AD (C1) case. (D–F) Parv-ir PCs and Parv-ir interneurons (black arrows) within the ML in a 69-year-old female HC (D), 44-year-old female with DSD– (E), and a 72-year-old female with AD (F). Upper right insets (D–F) are higher magnification images of the Parv-ir PCs outlined in solid black boxes, while upper left insets are higher magnification photos of the Parv-ir interneurons (outlined by dashed lines) within the ML, most likely stellate and basket interneurons in (D–F), respectively. Note the presence of many more Parv-ir interneurons in HC (D) compared to DS (E) and AD (F). Scale bars: (C) = 50 μm and applies to (A,B,D–F); (A1–C1) insets = 30 μm; larger insets in (A–F) = 10 μm; smaller insets in (D–F) = 20 μm.

