Figure 9.
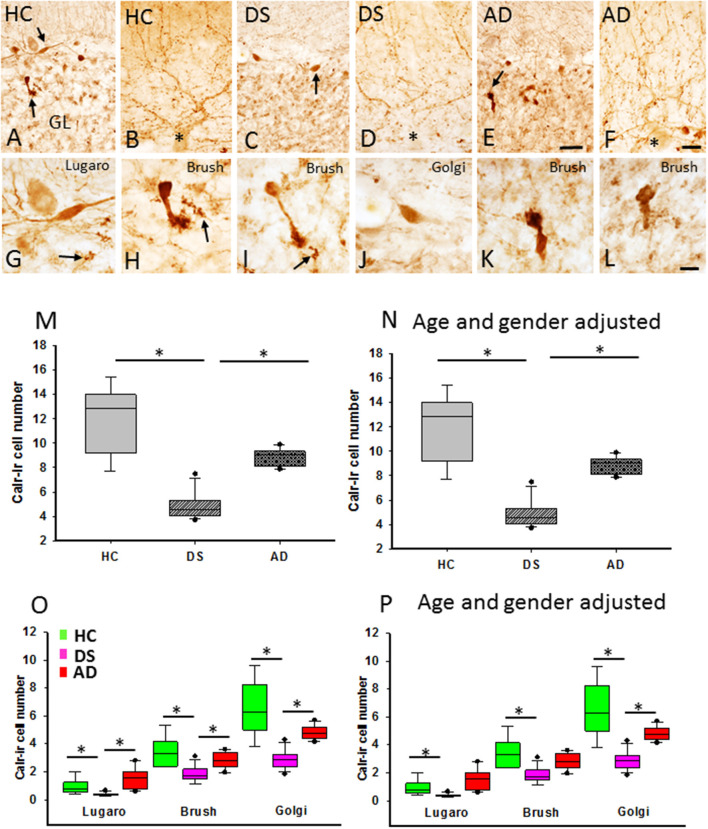
Photomicrographs showing Calr-ir cells (A,C,E) and beaded climbing fibers (B,D,F) in the GL and ML, respectively, in a 66-year-old female HC (A,B), 46-year-old male with DSD+ (C,D), and a 72-year-old female with AD (E,F) case. Note the reduction of Calr-ir cells in DS (C) and AD (E) compared to HC (A). High-power images of an elongated Lugaro (G) shown in (A) (upper arrow) and a unipolar brush cell (H) (lower arrow in A) from a HC, Golgi cell (J) shown in (C) (arrow) and a unipolar brush interneuron in DS (I), as well unipolar brush cells (K: indicated by an arrow in E; and L) in an AD case. Note the presence of GL Calr-ir MF rosettes in (G–I) (arrows). Boxplots showing a significant reduction in Calr-ir cell numbers in DS compared to HC (M; Kruskal–Wallis, p < 0.001) and AD (M; Kruskal–Wallis, p < 0.002), even after adjusting for age and gender (N; ANCOVA, p > 0.005). The number of Calr-ir Golgi, unipolar brush, and Lugaro cells was significantly reduced in DS compared to HC (O; Golgi and brush: Kruskal–Wallis, p < 0.01; Lugaro: Krukal–Wallis, p < 0.001) and AD (O; Golgi and brush: Kruskal–Wallis, p < 0.01; Lugaro: Kruskal–Wallis, p < 0.001). Age and gender adjustment revealed a significant reduction in the Golgi, brush, and Lugaro Calr-ir cell number in DS compared to HC, and only Golgi Calr-ir cell numbers were also reduced compared to AD (P). CF, climbing fibers; MF, mossy fibers. Asterisks in (B,D,F) indicate PCs. Scale bars: (E) = 50 μm applies to (A,C), (F) = 25 μm applies to (B,D), and (L) = 10 μm applies to (G–K). * denotes significance between groups.

