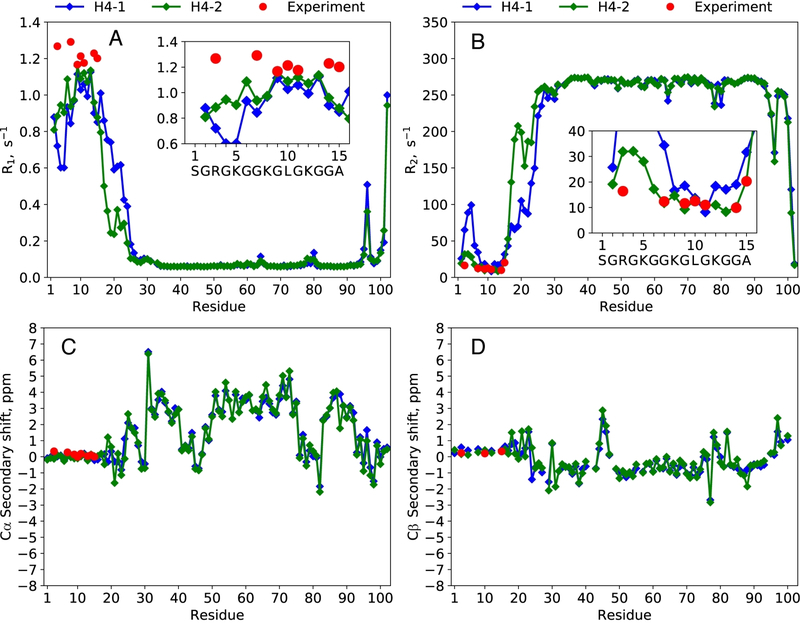
Figure 2.
(A,B) 15N relaxation rate constants R1, R2 and (C,D) 13Cα/β secondary chemical shifts δsec for H4 histone proteins in NCP. Experimental values are shown with red circles, the results of MD-based calculations—with blue and green diamonds (first and second copy of H4, as enumerated in the structure 3LZ0). The MD trajectory is that of NCP in TIP4P-D water, with a net length of 2 μs. Additionally, 1HN and 15N δsec data are summarized in Figure S5.

