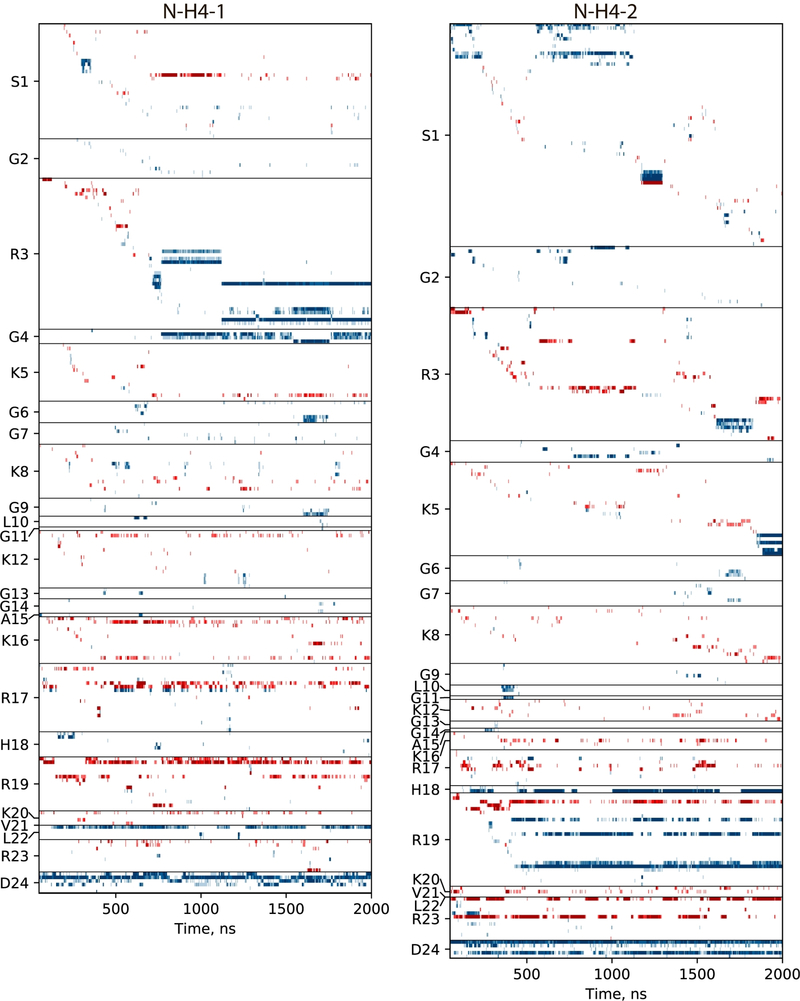
Figure 3.
Traces of the interactions between N-terminal tails of H4 histones (two copies in the NCP, residues 1–24) and the remaining part of the NCP. Each horizontal band represents a specific interaction involving one of the tail residues (indicated on the y-axis). For a given residue, interactions are sorted according to the time of the first appearance; the ordered list that identifies all interactions can be found in Table S2. Hydrogen bonds and salt bridges are coded blue and red, respectively. The definition of salt bridges between DNA phosphate group and arginine or lysine side chains is illustrated in Figure S6.

