Figure 4.

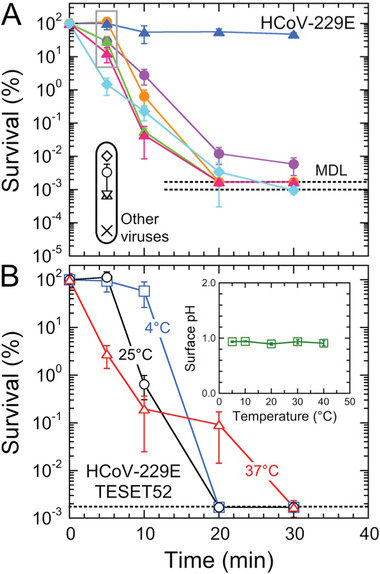
A) Survival of the HCoV‐229E virus on different anionic block polymers (color‐matched to the titer data in Figure 3). The symbols (black open) in the black oval at 5 min correspond to previously examined[ 23 ] viruses (HAd‐5, circle; influenza A, triangle; VSV, X), as well as two additional ones [PI‐3 (diamond) and X‐MulV (inverted triangle)], on TESET52. The data at 5 min (in the gray box) are statistically non‐significant, according to the p‐values listed in Table 2. B) Survival of HCoV‐229E on TESET52 as a function of exposure time at three different temperatures (in °C, labeled, and color‐coded): 4, 25, and 37. The temperature dependence of the surface pH of DI water is included in the inset. In all cases, measurements listed at the MDL (dotted line) indicate at or below the corresponding survival level, and error bars represent the standard error. Color‐matched solid lines serve to connect the data.
