Figure 5.

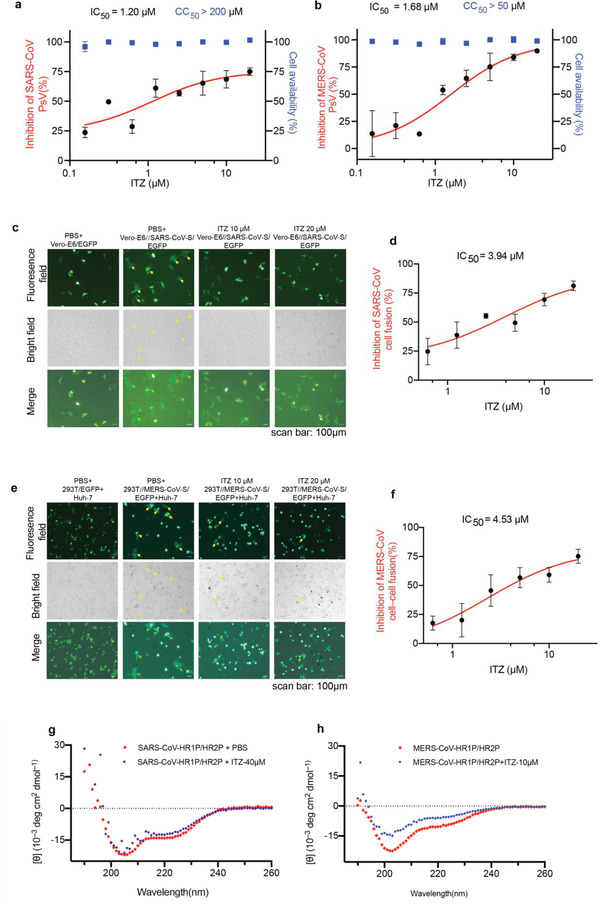
The inbition of ITZ on SARS‐CoV and MERS‐CoV PsV infection. a,b) Pseudovirus infection (red) and cell viability (bule) were determined by using luciferase and CCK‐8 assays, respectively. Dose‐response curves and IC50s of ITZ on inhibiting the entry of a) SARS‐CoV PsV and b) MERS‐CoV PsV. Each data point represents the mean of there technical replicates (n = 3), data are expressed as means ± SD (error bar). c) Cell‐cell fusion mediated by SARS‐CoV S protein. Vero‐E6 cells transiently expressed SARS‐CoV S protein and EGFP (293T//SARS‐CoV‐S/EGFP). ITZ (10, 20µm) significantly inhibited SARS‐CoV S‐mediated syncytium formation. Vero‐E6/EGFP, Vero‐E6 cells transfected with vector (pAAV‐IRES‐EGFP), scale bars, 100 µm. d) Dose‐response curve and IC50 of ITZ on inhibiting SARS‐CoV S‐mediated syncytium formation. e) ITZ (10, 20µm) inhibited the MERS‐CoV S‐mediated syncytium formation on Huh‐7 cells at 24 h. 293T/EGFP, HEK‐293T cells transfected with vector (pAAV‐IRES‐EGFP). Scale bars, 100 µm. f) Dose‐response curve and IC50 of ITZ on inhibiting MERS‐CoV S‐mediated syncytium formation and quantification of GFP‐positive syncytia. Three images per condition were acquired and processed. Data were normalized to PBS controls and were depicted as fold changes in mean GFP expression. g,h) ITZ interfered with the formation of 6‐HB of g) SARS‐CoV or h) MERS‐CoV, as analysed using CD spectroscopy. The CD profiles of SARS‐CoV HR1P/HR2P (15 µm) and MERS‐CoV HR1P/HR2P mixture (10 µm) showed the characteristic α‐helical spectrum with double minima peak at 208 and 222 nm. With the addition of ITZ (40 µm for SARS‐CoV and 10 µm for MERS‐CoV), the secondary structures of 6‐HB in HR1P/HR2P mixture were affected, showing a lower α‐helicity.
