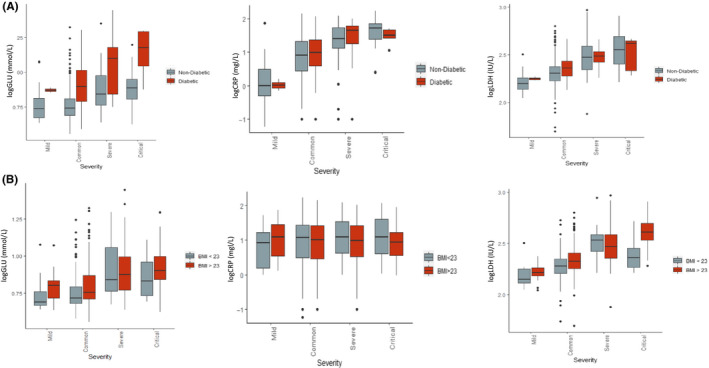
FIGURE 3.

Glucose, CRP and LDH levels and its association with severity in (A) individuals with and without type 2 diabetes in COVID positive cases; (B) individuals in the overweight/ obese category (BMI > 23) compared to normal weight (BMI < 23) in COVID positive cases. Values for glucose, CRP and LDH represent log transformed values
