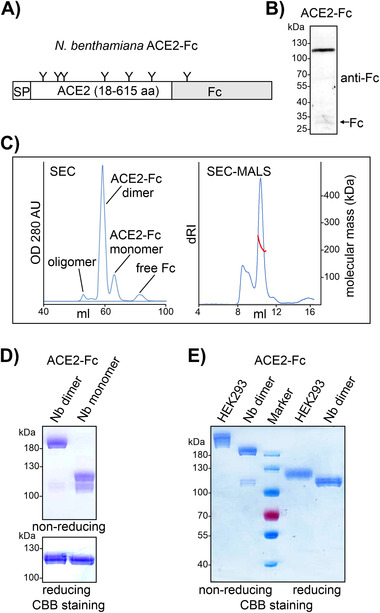
FIGURE 1.

Expression of ACE2‐Fc in N. benthamiana. (A) Illustration of the expressed human ACE2‐Fc protein. N‐glycans (“Y”) are indicated. SP, signal peptide from barley α‐amylase. (B) Immunoblot detection of ACE2‐Fc in total protein extracts from ΔXT/FT N. benthamiana extracted 4 days after infiltration. (C) Left panel: SEC purification of affinity‐purified ACE2‐Fc. Right panel: determination of the native molecular mass of dimeric ACE2‐Fc by SEC‐MALS. Blue trace: protein concentration monitored by differential refractive index (dRI). Red trace: MALS estimates of native molecular mass. (D) SDS‐PAGE of N. benthamiana‐produced dimeric and monomeric ACE2‐Fc. CBB, Coomassie Brilliant Blue staining. (E) SDS‐PAGE of HEK293‐derived and plant‐produced ACE2‐Fc
