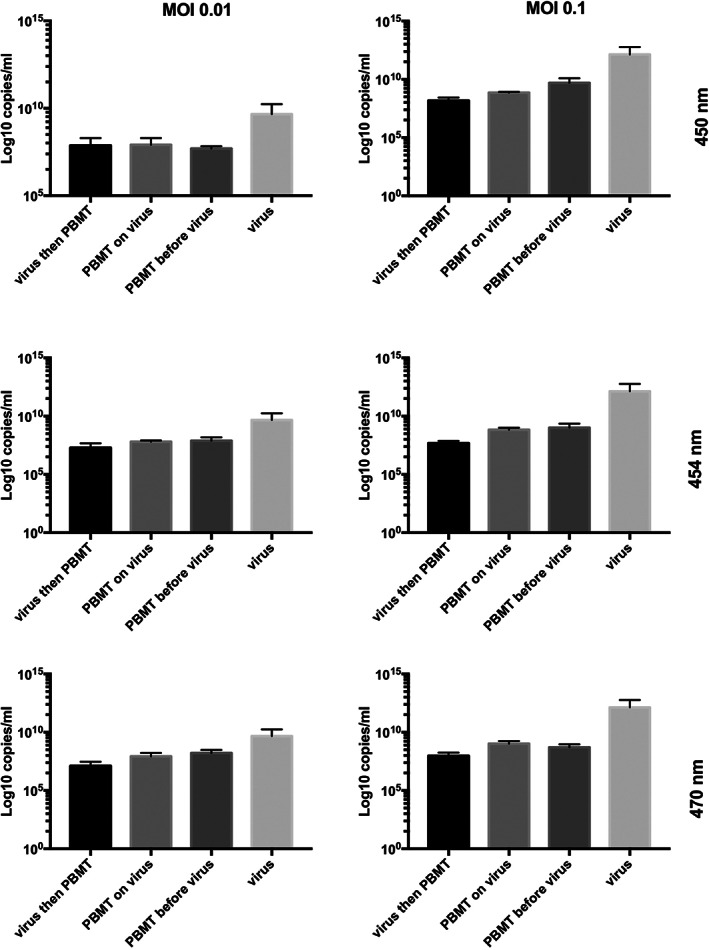
FIGURE 3.

Effect of blue LED at 450, 454 and 470 nm on SARS‐CoV‐2 in Vero E6 cell line at 72 hours post‐infection. SARS‐CoV‐2 was used in the experiments at a multiplicity of infection (MOI) of 0.1 and 0.01. Three settings were employed: SARS‐CoV‐2 was irradiated alone and then transferred to the cells for 1 hour, already infected cells (1 hour) were irradiated, cells were irradiated and then infected with the virus for 1 hour. The viral load was quantified from the supernatants and is reported as Log10 viral copies/mL. Kruskal‐Wallis (KW) test corrected for multiple comparison with Dunn's test was utilized for the comparison between not irradiated cells (treated only with the virus) and the other experimental conditions (*P < .05, **P < .01). (A) SARS‐CoV‐2 viral load after PBMT at 450 nm (MOI of 0.1). (B) SARS‐CoV‐2 viral load after PBMT at 450 nm (MOI of 0.01). (C) SARS‐CoV‐2 viral load after PBMT at 454 nm (MOI of 0.1). (D) SARS‐CoV‐2 viral load after PBMT at 454 nm (MOI of 0.01). (E) SARS‐CoV‐2 viral load after PBMT at 470 nm (MOI of 0.1). (F) SARS‐CoV‐2 viral load after PBMT at 470 nm (MOI of 0.01)
